29/04/2008

Ten tips to become an infographics artist

Some days ago, Armando Sotoca,blogger of the great graphic design site Criterion (in spanish), ask me to ellaborate a decalogue about journalistic infographics. You can access the article directly clicking here. But, in case you don't speak spanish, here is a translation

1. INFORMATION
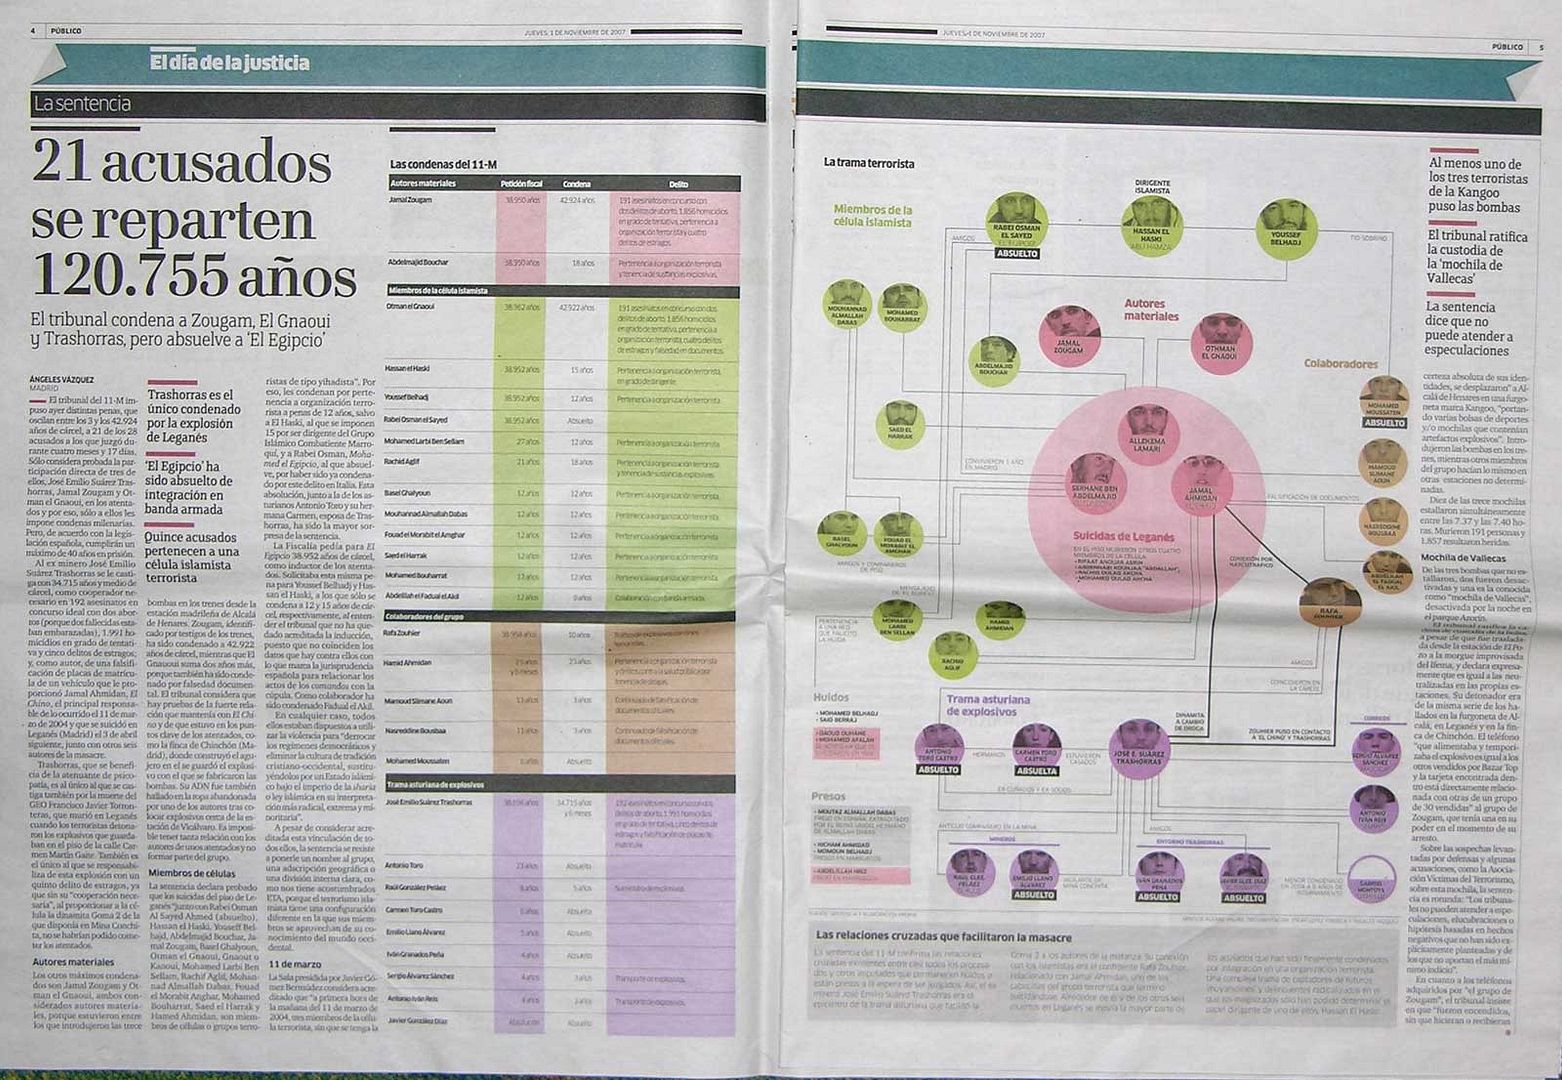
In journalistic infographics, information goes first. The goal of the graphic is to give information. Design in this discipline is a tool, not a goal. Rigor and make information accessible and understandable are above stethics. Spectacle just for spectacle doesn't hel the reader.

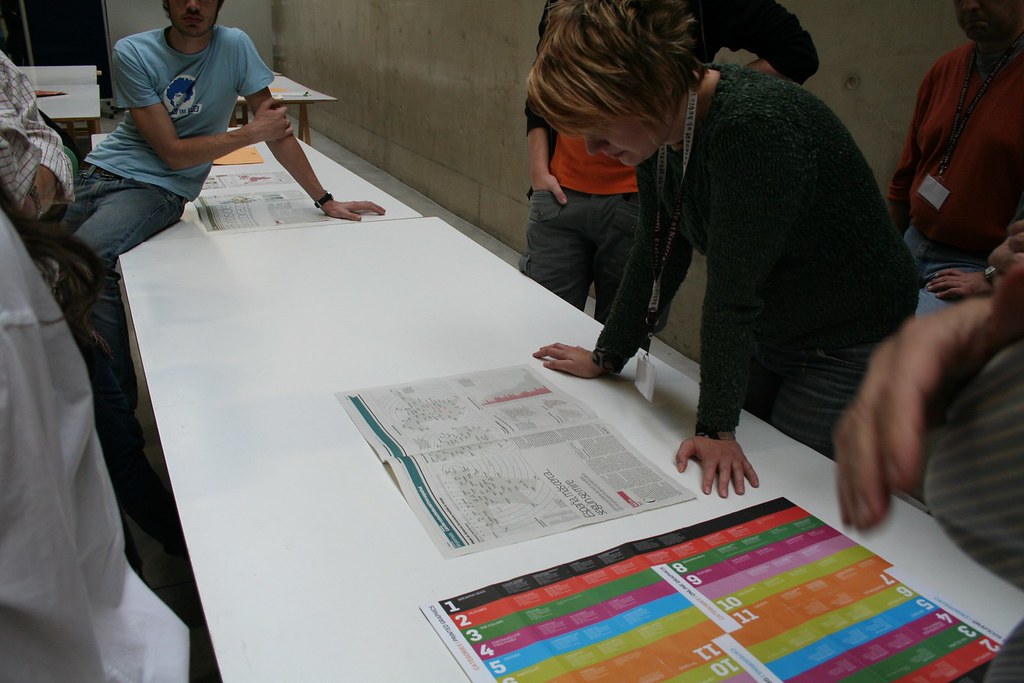
2. ORGANIZING INFORMATION
Graphics are fast reading elements. The content must be organized to guide the reader and don't waste his time.
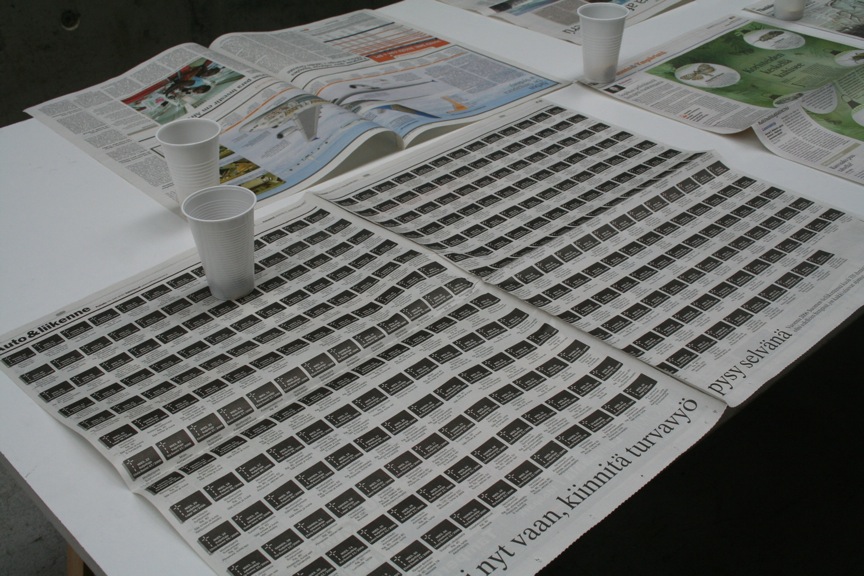
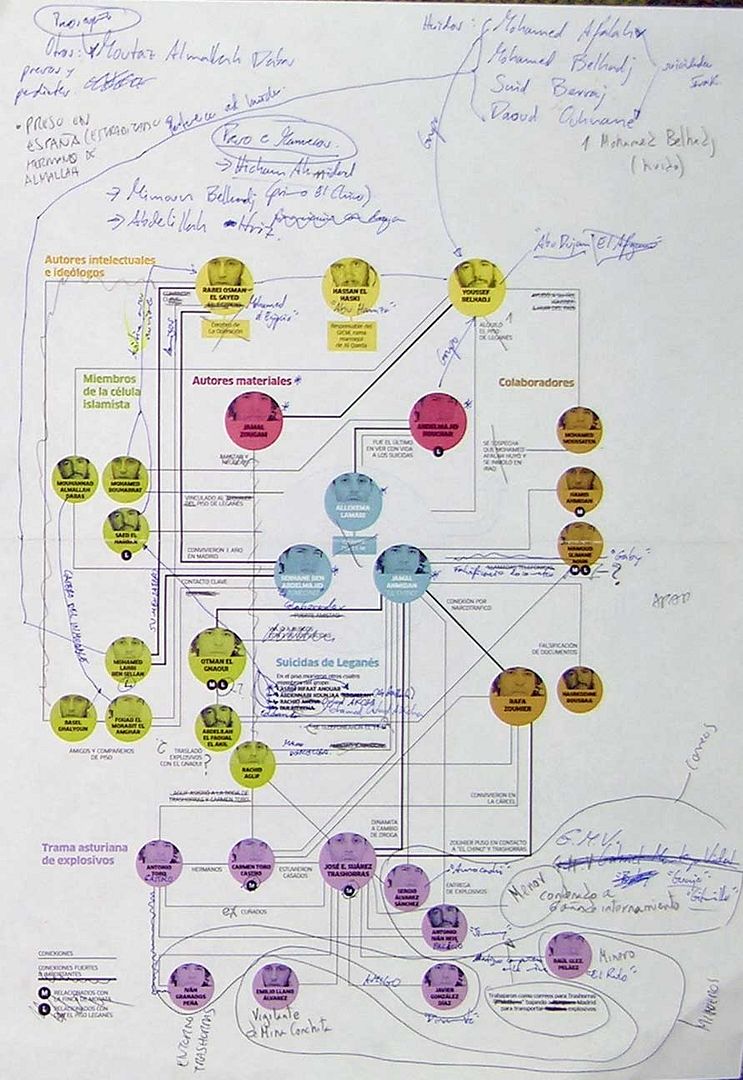
3. COLOR
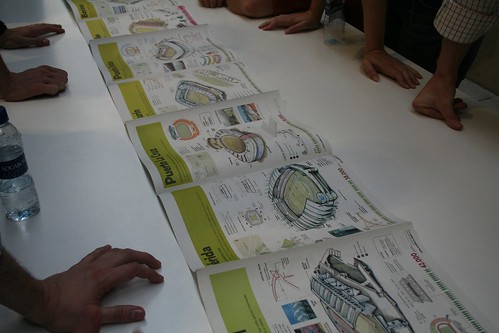
To guide the reader, color could be our best tool. And it doesn´t matter if we print on B/W. Clear tones for the less important, dark for those elements on which we want to focus teh attention. John Grimwade and his 'red line' became famous for his good use of color on inforaphics


(Click to enlarge on John Grimwade's portfolio)
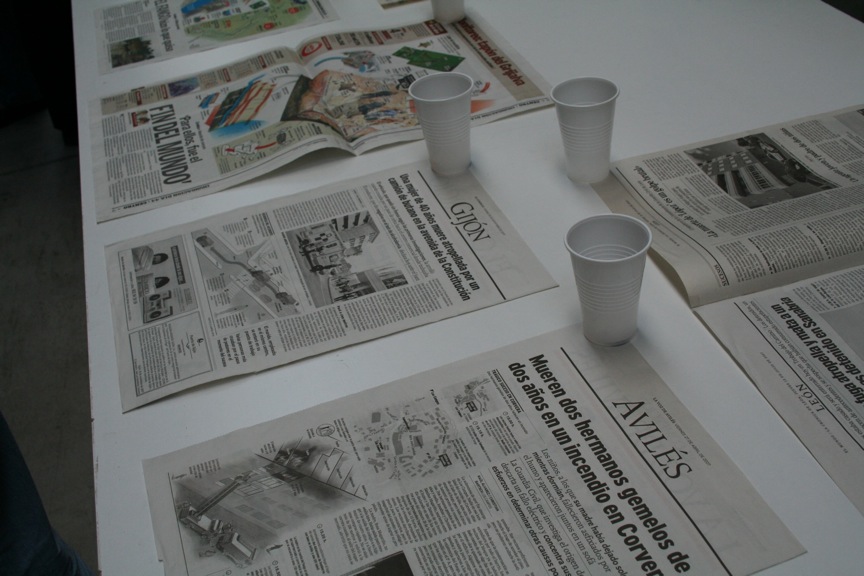
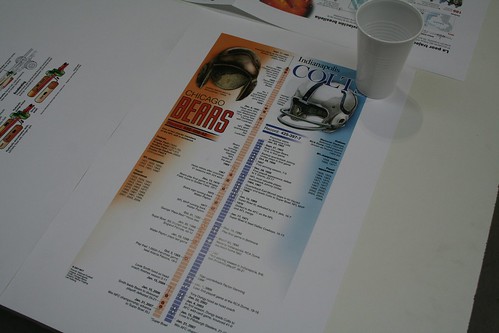

4. CLEAN AND CLEAR
If we want color to focus the attention, the rest of the elements should be clean and clear. Not just on their tones. Avoid horror vacui. Baroque graphics usually doesn't work on newspapers.
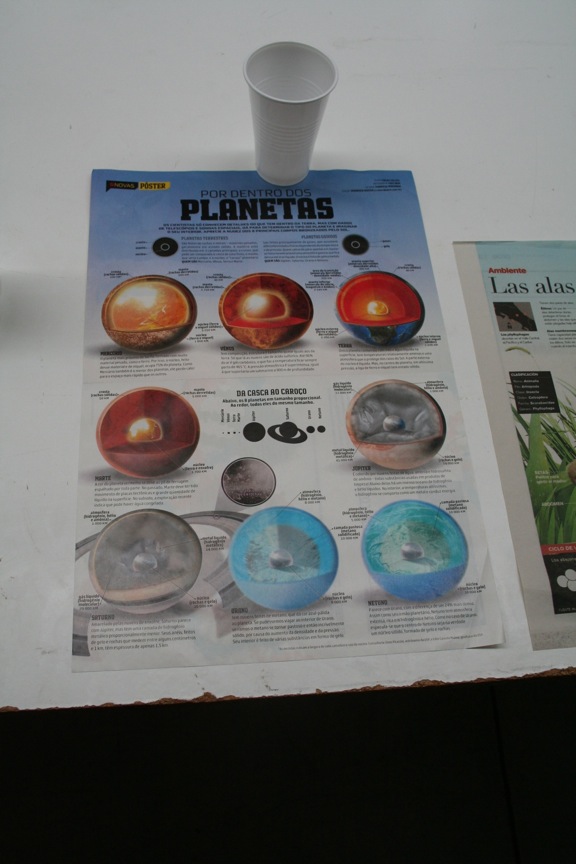
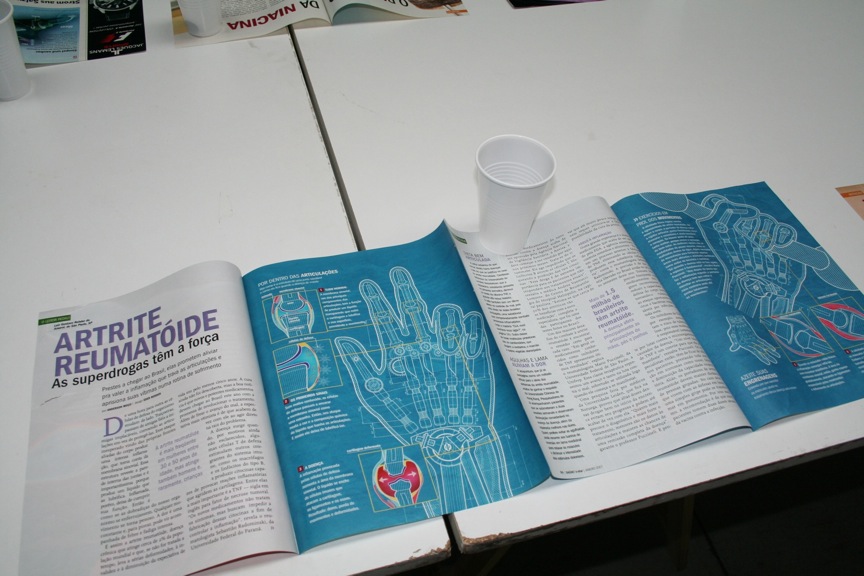
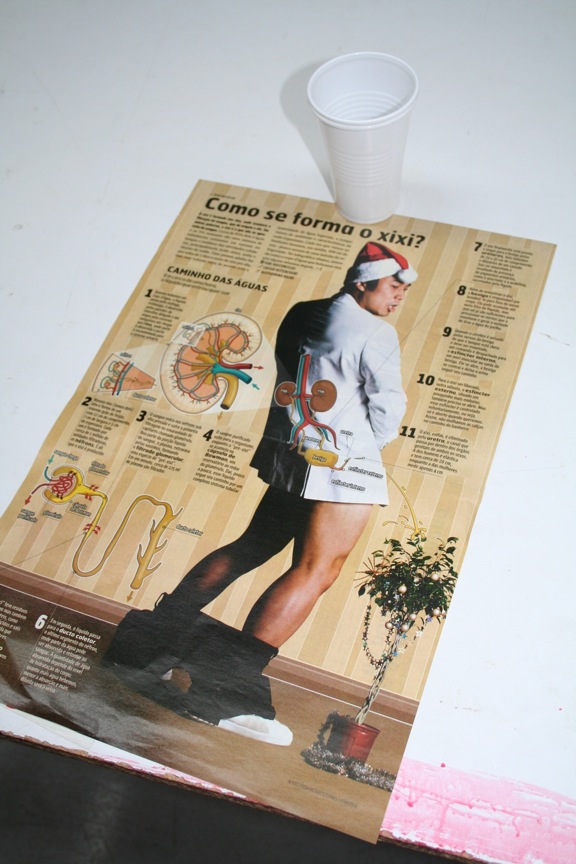
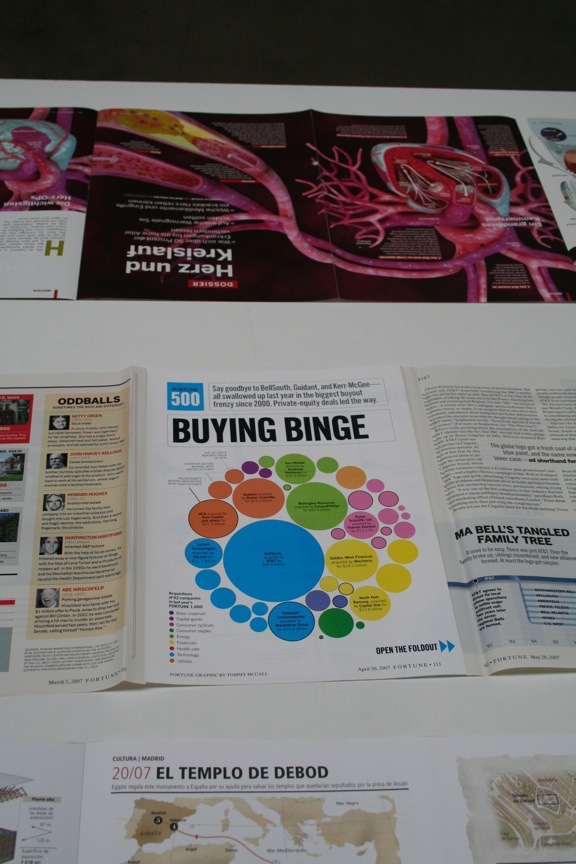
5. SHOW DON’T TELL
Always think on this sentence. Newspapers are full of text. Use graphics to explain things on a visual way.

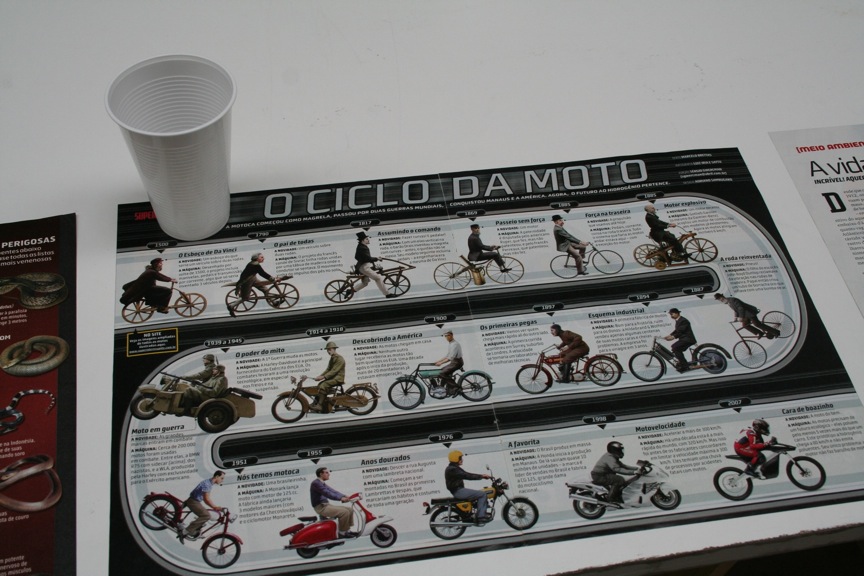
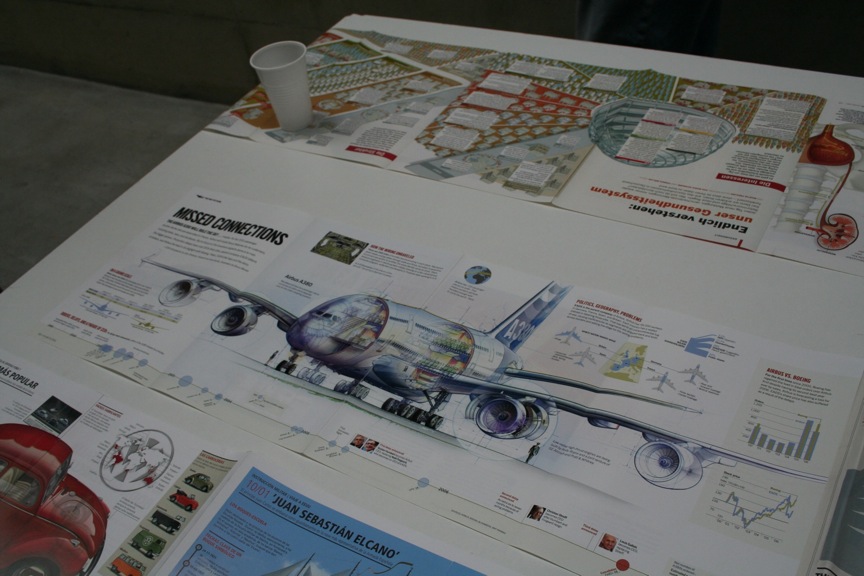
6. COMPARE AND MEASURE
In journalism, context is very important. Infographics help a lot on this field. Comparations, measurementa and actual scales make information easy to understand in many cases.
An example, about the steps of Buzz and Aldrin on the moon:

(Click to enlarge on StrangeMaps)

7. DON'T BREAK SCALES (IF IT'S NOT ABSOLUTELY NECCESARY)
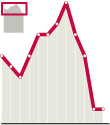
Many tiemes, on economics issues above others, we use to break teh scale to show a trend. But we're changing the real trend doing this. If we have to do it, include a locator of the actual scale.
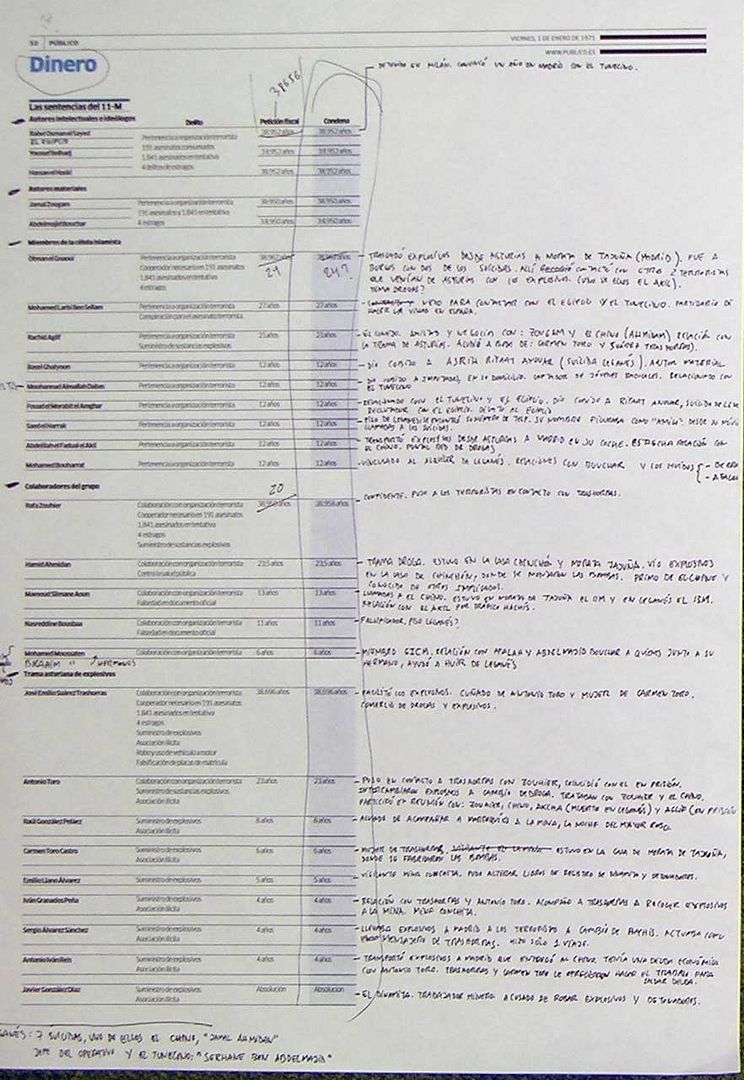
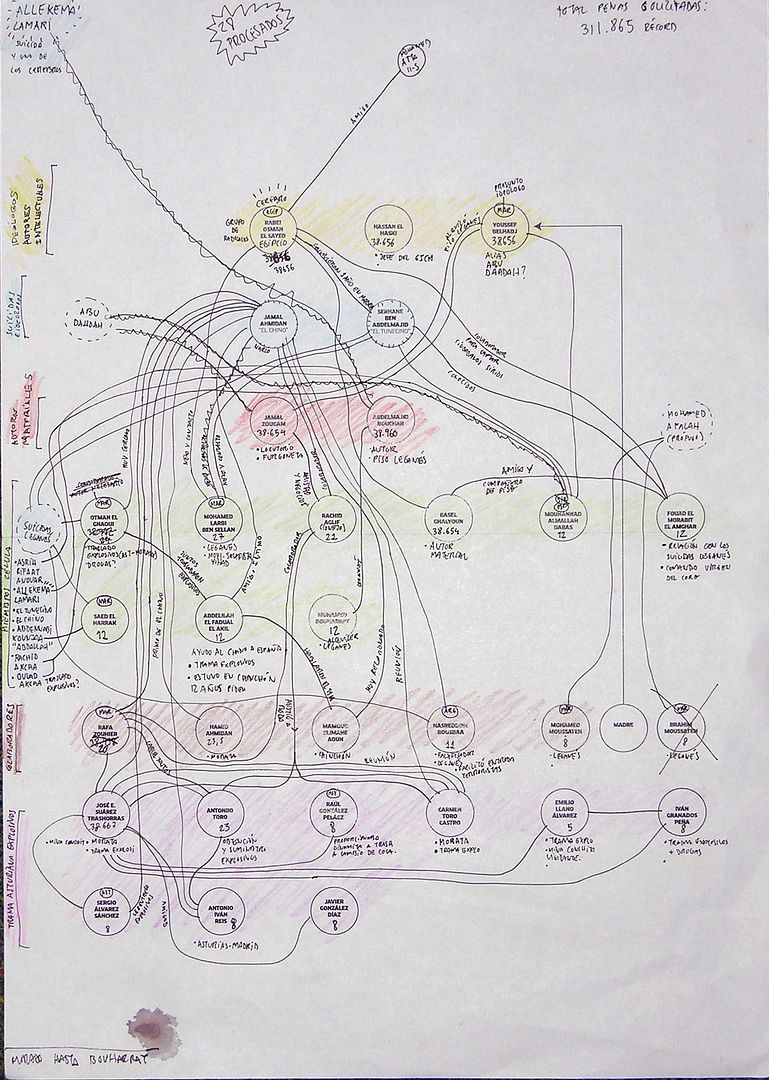
8. DOCUMENTATION
To develop good graphics, many times we need great amounts of data. A graphics needs mre information than a text. A text could say 'in Somalia'. When you do a graphic, you need to place the spot on a exact place.

9. WRITERS ARE ALLIES
On every job, team is basic. On this one, when we don't know what does the client (reaers) exactly wants and the perception of it is subjective.

10. KEEP LEARNING
Keep attention on new trends, and not just on infographics: design, rests of journalism, infovis... Never think that what you know is enough. That is a mistake on any professional field, but more on this one, where the product lasts one day maximum.

Of course, comments with additions, rectifications or any different ideas are absoluteley welcome. Thanks in advance.

28/04/2008

The bests sports graphics of the year according to Sports Designer

Reading Maquetadores, I could know that Sports Designer awarded some days ago its 2007 awards for the best of this discipline. At the infographics category, the big one was for Washingtong Post,with this piece by Laura Stanton and Bonnie Berkowitz


And these were the other finalists:


Washington Post. Todd Lindeman and Bonnie Berkowitz


The Boston Globe. David Butler, Ed Wiederer and Brian Gross


The Boston Globe. Daigo Fujiwara and Brian Gross


Washington Post. Todd Lindeman and Bonnie Berkowitz

21/04/2008

Moonwalking on a soccer field

I always try to avoid the area comparisons with soccer fields. It's too obvious, and, I always avoid it in cases like 'as 400 soccer fields'. It doesn't explain anything at all. But I must recognize that this one works.


Via Strangemaps

Charles M Blow, infographic columnist

Yesterday I knew two news of big importance from Alberto Cairo. First, Charles M. Blow leaves National Geographic and get back to The New York Times. This is just another (although very important) of the great amount of movements we're having on the infographics scene. But the real new is that he does it as'inforaphic columnist'. Here's his first column:


The New York Times is used to have graphics on its opinion section, as it did with its famous (and sometimes polemic) OP charts. But this is a step further. Is an infographics artist as columnist, the graphic made column. But it has one problem. Alberto uploaded on his blog the column as it was published:


And I agrre with him on the problem. The graphic should talk by itself. The text shouldn't benecessary. Maybe that's the next step.

But I would like to highlight a sentece from Cairo's analysis:

The infographics community has spent decades complaining about the little respect that directors and staff writers have to information visualization, Blow keeps showing what should be obvious: respect always should begins by ourselves. The graphics department of the NYTimes has earned the importance they have inside and outside the newsroom; step by step, story by story, always struggling for a bigger rigor, bigger quality, an increasing seriousness, defining the bounds between art and visual information. To the point that someone thinked that, oh miracle, a graphic artist could write on the opinion section, at the same page that Krugman, Kristof or Herbert. Blow, a 'grahic columnist' is just the culmination of a process started years ago.


18/04/2008

Organizing information

'I'd love to work at the infographics department, but I' very bad drawing'
How many imes have we heard this from our colleagues at the newspaper? Me, a lot. And I always answer the same: drawing is useful, but it's not necessary. Myself draw not very well, not bad, but I can't call it as one of my skills. Bu I've neer needed it. The most important skill, in my opinion, is organizing information. And today, taking a look to the New York Times web I found a perfect ally to keep this idea:


Is a big article condensed, clarified, simplified. It takes the reader understand the information fast and easily. And I could bet that much more people have accesed the information that would have done it with a plain text and photo. And we just needed a simple diagram.

15/04/2008

The graphics that didn't get an award on Malofiej 16

Taking a look to the Malofiej 16 pool at Flickr and I discovered there graphics that I haven't seen among the awarded. But is always good to have an eye on what we're doing around the world. If it's awarded or not.

Maybe I'm wrong (it would be very easy) and soem of them have been awarded (it would be good to know it if you find some), but it's just to take a look...


13/04/2008

30 inspirational graphics


The blog Ateneu Popular, on its serieDesign Inspiration has chosen 30 inspirational infographics.
Its author is coherent with what he likes: lots of Zarracina, Baptista, thinngs form El Mundo and Rafa Estrada, Álvaro Valiño (my actual colleague at Público), brazilian graphics, and even one mine (that's autoadvertising, ok)... Being spanish, it's normal than most of them are from Spain.
You can see the selection at Ateneu Popular


09/04/2008

Ten excellent blogs

Yesterday, I was considered by Juan Antonio Giner at his blog Innovations in newspapers with an 'Excellent Blog Award', which made me very happy. Above all coming from someone whose blog was one of the reasons I started blogging.
This 'award' brings along a task. And is choosing your 10 Ecellent blogs. Apart, obviously, from Innovations, which gave me the 'E', my other chosen 9 are (by alphabetical order):

Alberto Cairo.
Not properly a blog in its english version, but with very interesting weblog, opinions and articles by Multimedia infographics professor Alberto Cairo.

La Buena Prensa (Spanish).
I have been just introduced to it a nd I relally liked it. Examples on good behaviour on journalism and design. It's a kind of opposite to a spanish blog, MalaPrensa, whcich talks about the daily mistakes on media.

Cuatro Tipos (Spanish).
Design, typography and graphics by four great designers.

Information Aesthetics
Data visualization and visual communication

Karl Gude
A funny view of infographics. I was lucky to meet Karl Gude judging on my first year in the Malofiej staff, and I always liked his good humuor and who he can maintain it on job topics.

Maquetadores (in spanish)
Paco Oca presents us news and curiosities about journalistic design

Shane Richmond
Tech blog at Telegraph.co.uk.

Visión (in spanish)
Julio Alonso, editoral adviser at Grupo Joly, talks about new trends in journalism

Xocas.com (in spanish)
Xocas, online infographics editor at Newsweek, doesn't post too much. But when he does, it really worths the waiting.

08/04/2008

Fresh designs on your graphics department

Michael Agar, graphics editor at The Independent on Sunday, writed an article for Press Gazette two days ago about the role of infographics on newspapers. You can access the whole article on the previous link, but here are some of the sentences I would like to highlight:

Is it right that graphics can only be maps and charts, or the excruciatingly clichéd artistic impressions of military positions being bombed into oblivion?
We must move away from the dull and the obvious and ask serious questions regarding the content and structure of an infographic, just as we would a written piece of journalism. What about the “why?” and the “where?” By “how much?” and “how does this compare?”.


Our profession has not moved on over the past 15 years, but our readers have. Today’s readers and viewers demand visual content, interactivity and non-traditional narrative. But most of all they demand information.


Understand that infographics are not illustrations that merely support the text, they can also show and explain much more to your reader. Information, not decoration


Raising the journalistic standard of your graphics staff is a priority. For these editorial changes to be successfully implemented, your graphics editor and their staff must be encouraged to think like journalists, and not as artists.


You can't imagine how much I agree with most of this

Making of. The 11M judgement graphic

We finally have drawers at Público. This made us to take another look to the great mountains of papers we have create on these six months of life.
Among disastarers we wouldn't like to have seen again and little good things were the sketches for the 11M judgement graphic by Alvaro Valiño.


This is the fnished graphic. A relationships diagram and a table with resolutions which share a color code. The graphic was a breaking news, made the day the judge gave the resolution, but we started thinking on it before. And this is hw we made it.
We had the name of the judged, and, with the terrorism specialist of the newspaper (I'm talking about a journalist, not a terrorist), Óscar López Fonseca, we reviewed the charges and which could be the sentences for each one.


We took the name and we think the way to organizate the relationships between judged, just as we supposed, waiting for the judge and his resolution.


We thought on the style that could have the diagram ad decided that the table should have the same colors. We thought (never seriously) on just using the skecth. We really liked it.


As you can see, there were a lot of changes (if you really look at out, we just used 3-4 faces for the scheme). We were constrcting the relations meanwhile Oscar was reading the sentence the day it was released.
The final result is the one above all. People from the newspaper liked it, many people we asked liked it ant it had a gold at Malofiej and a SND Award of Excellence. We think is a very easy and clear way to explain the information and have the reader informed, that was what whe tried.

03/04/2008

Shahhe Ilyas. Graphic experimentation

Taking a look to this maldivian designer web,
shaheeilyas.com wrths the time.
But maybe the most interestnig part (for me), is what he calls 'experiments'. Inside this denomination are some great ideas as the web Framing Leaders


As himself explains:
“Framing Leaders” is a website consisting of algorithmically generated framed pictures of Heads of Governments based on their length in power, latest Press Freedom Index (RSF) and Corruption Perceptions Index (TI) for the country. Leaders are all about borders, power, constrains which the algorithm translates to ornaments, proportions, matting and darkness.


Other of his 'experiments'is a simple graphic design idea. Showing flags as chart pies depending on he color used on it and its area on the flag.

of those famous flags by Grande Reportagem. In most of the cases, is still easy to see how country do they represent.

And a third detail, not so original, but still nice. Mvblogosphere, elaborated with other pals, has a chapter with its visualizations that worths a look. As an example, here you are the relationships between madivian bloggers (click to enlarge)


Thanks to Álvaro Valiño for the discovery.