

This London Tube map by Harry Beck used form 1933 is considered a great 'hit' of modern infographics. It meant a big step for visual abstraction and diagrams as part of everyday life.
Form then and each day more often, the tube map has become a metaphor to explain any serie of connections.
One of the last examples is this one published by Richard Watson which shows a map of trends and predictions for 2010-2050. (Click on it to get the PDF form nowandnext)

Is such a common place in infographics that the 17th Malofiej Awards decorated the University of Navarra (home of these awards) with a tube map of the main characters and subjects of infographics.

But everybody could remember the grear Metro do Rock infographic publisehd by the brazilian magazine Super Interessante

(Image: Infograthinking)
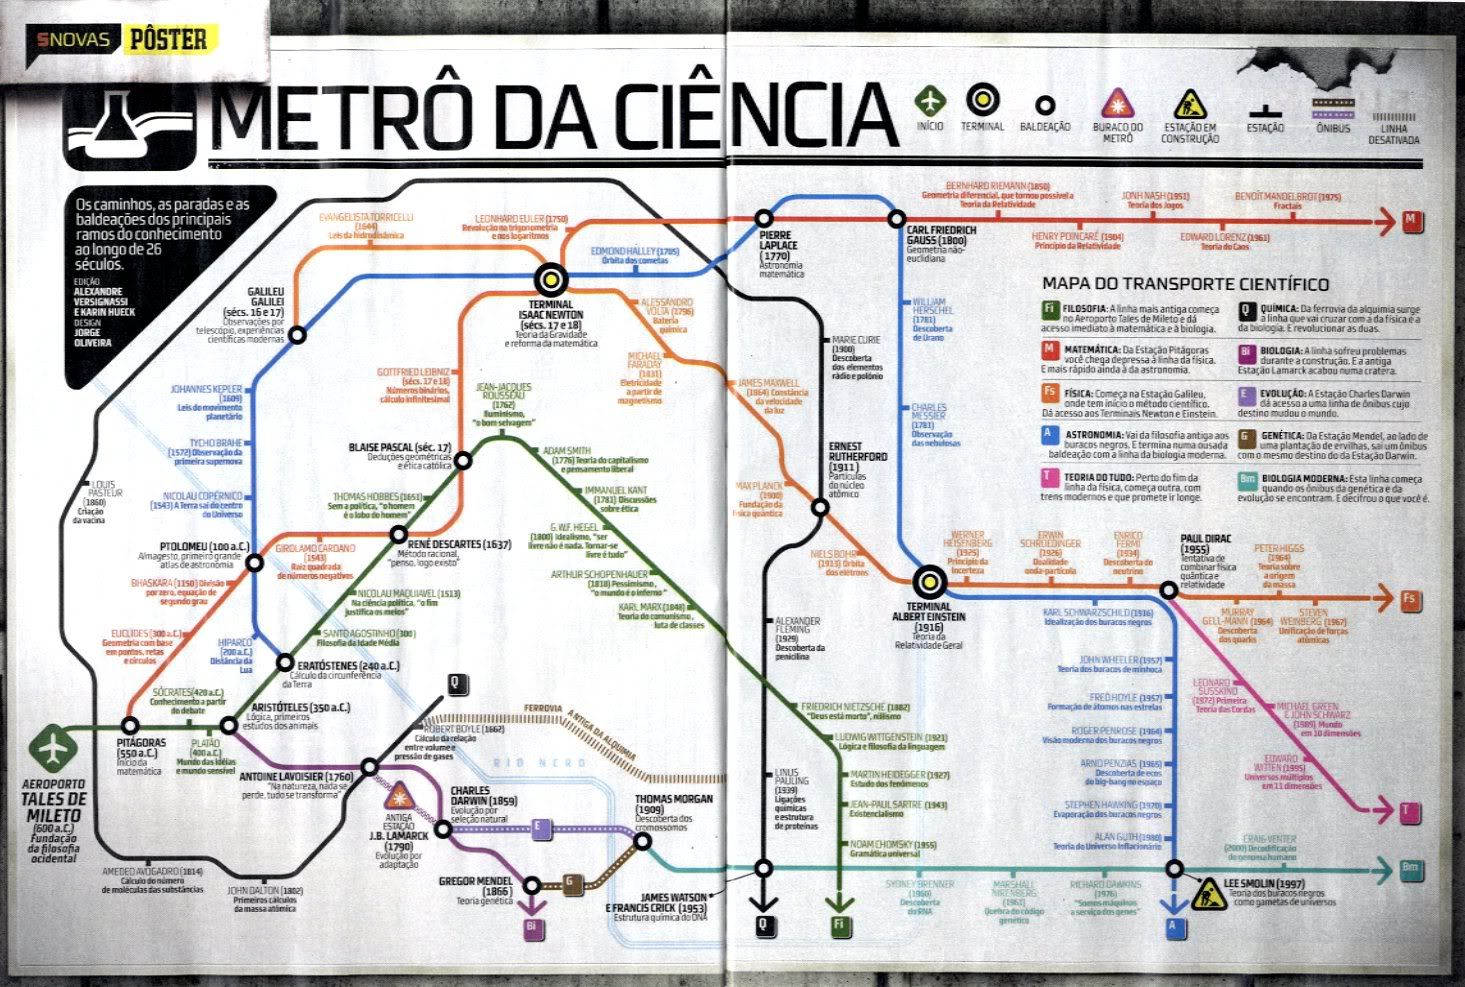
The idea worked so well, that years afetr that their sister magazine Mundo Estranho, made a similar graphic with science as starring.
And one of the most successful infographics on the whole internet last year was this 'Web Trend Map', with the same metaphor, by informationarchitects.

(Click on image to access a hi-res photo at Paco Prieto's blog)
Share
2 comments:
O Metrô da Ciência is also from Superinteressante, not from Mundo Estranho. Saludos. Alessandra
I always had trouble understanding Tube maps until I learned infographic style. Now it is as easy and fast as getting viagra online
Post a Comment