28/11/2007

Old newspapers, fresh PDFs


Some may say that "there is no older thing than a newspaper the day after". That ould be true for the usual readers, those who just read newspapers to be informed. But for infographics artists, designers and all teh art department, newspapers are mre than news. In my department we like to take a look to foreigner papers although they're old, and in other department's I've been was usual for anyone coming from abroad to bring some issues of the national newspapers, just to have an eye over graphics and design.
These old things that are old newspapers are now on the internet. As just a few are going to pay to have a look to old newsapers, many webs release them and their PDFs on teh web, free to download, complete, not just front pages. And some of them don't need neither a registration. Click, and to the desktop. Here you are some useful links to take a look to the print editions. If you know any, please comment or send an e-mail to include it on the list
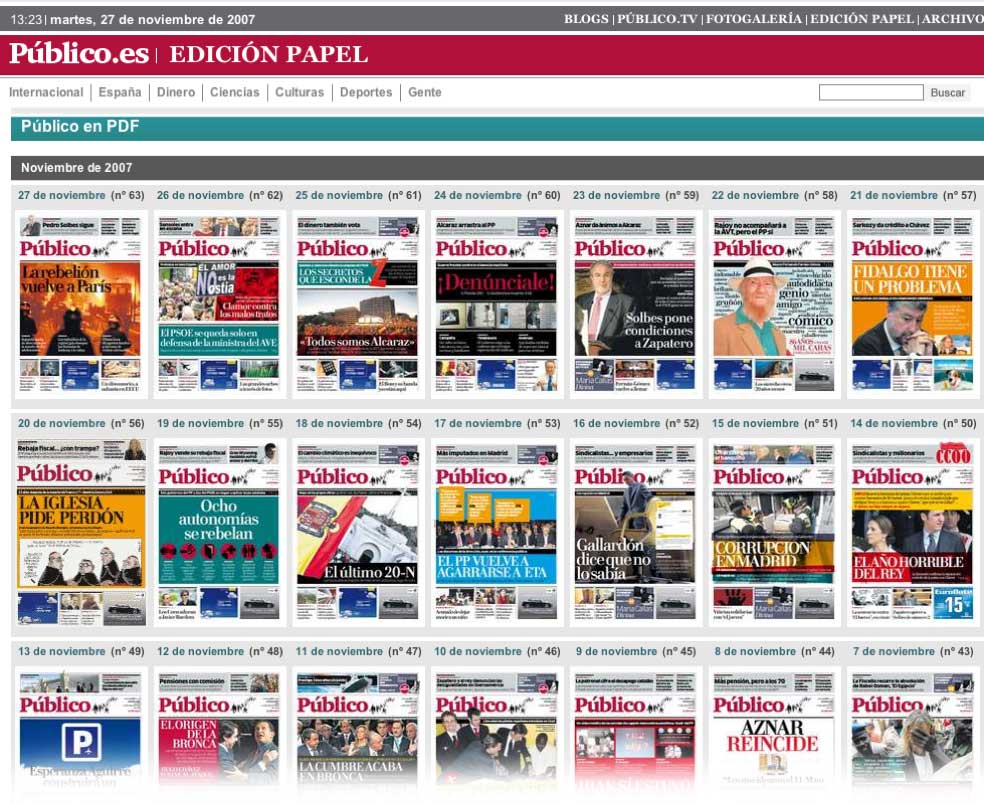
Público (Spain)
Público Papel
I couldn't forget the paper I work for, Each day, at midnight, the previous edition is released in PDF, the edition of the day ihave just fornt page and last page available.

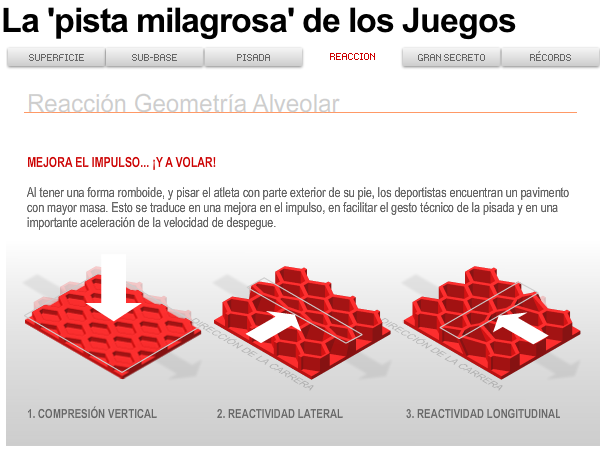
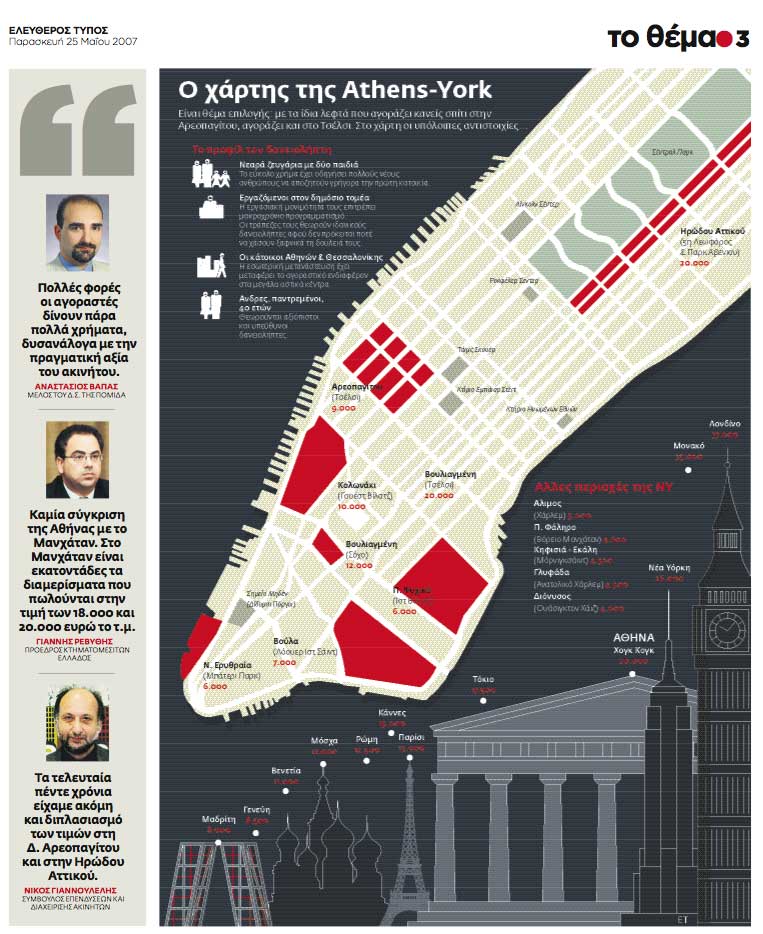
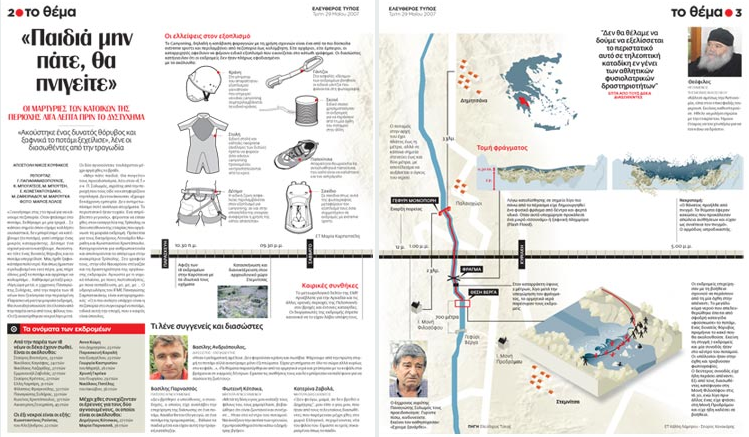
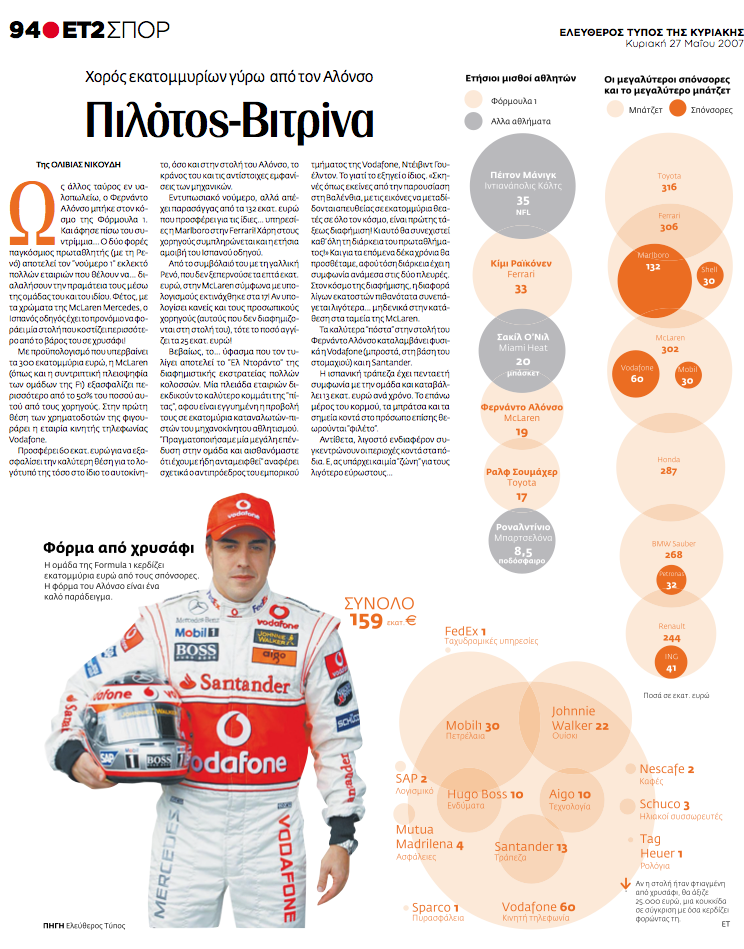
Eleftheros Typos (Greece)
Pdf Viewer
From the day of the redesign. At noon, the edition of the day is released. Great opportunity to take a look to the pages of teh chosen as Best designed national newspaper of Europe.

Free Press (Spain)
ADN
20 minutos
Qué!
If they're free on teh streeets, why not on the web?

Publico (Portugal)
Ediçao impressa

San Francisco Examiner (EEUU)
SF Paper

El Mercurio (Chile)
El Mercurio PDF

La Tercera (Chile)
Papel Digital

De Morgen (Belgium)
Krant

El Comercio (Perú)
Edición impresa

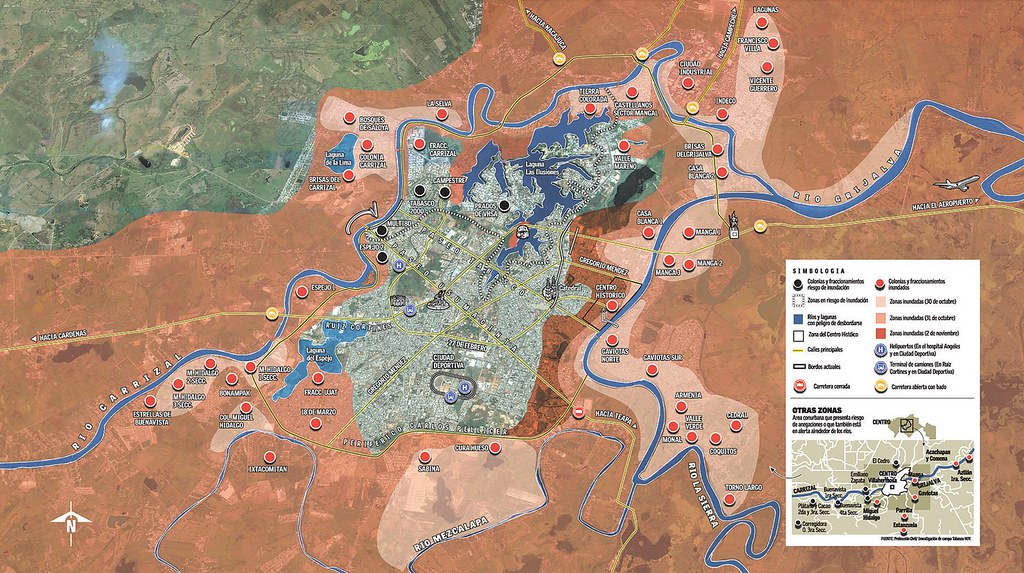
Tabasco Hoy (México)
Edición impresa digital
JUst meanwhile the emergency, but who knows... Sometimes these things come to stay...

Diario de Pontevedra (Spain)
Hemeroteca
Not updated, but in the month

Thanks to all those who have helped me sending links in the spanish edition of this web, and for all those who will send more!!

27/11/2007

Understanding USA


This is the title of a book that tries to explain on an infographic way the main statistical data of the northamerican country. Edited by Richard Saul Wurman. Some of the contributors are considered the biggest thoerics of infographics and infovis, as Nigel Holmes, MIchael Bierut and others, with results sometimes surprinsing, and not for good.
This book can be visualizated page by page on the web (UnderstandingUSA.com), and downloaded as PDF, and this is to be grateful.
Data are most of the times highly interesting, the way of presenting them is, sometimes, matter of discussion. Anyway, the different ideas about visual presentation and organization is always worthy to have a look.

In order to take a look, click here

25/11/2007

Marca graphics are definitely online


Marca.com has been long time "flirting" with online graphics, on a simple way. An little animation, a graphic with siome buttons to click... But they are already in online graphics world to stay, as is shown with this graphics about a new kind of athletics surface. Step by step, online graphics are spreading, although there are still a lot of places where, without an specific department for online graphicsm is difficult to deal with print and internet because of the lack of time. Big bosses still prefer print in most of the cases, so efforts are directed on that direction.
Congrats to our Marca colleagues.

22/11/2007

Eleftheros Typos, the best designed european newspaper


The greek daily Eleftheros Typos (Free Press) has been awarded best designed european newpaper on this edition of the European newspaper Awards, on the national daily category.
The Mayo News (Ireland) was chosen best local, El Periódico de Catalunya (Spain) best regional and Welt am Somtag (Germany), best weekly.

I got an enormous luck working in the InnovAtion team in charge of the redesign of the daily. Great luck, colaborating with great professionals as Juan Antonio Giner, Juan Señor, Javier Errea, Marta Botero, Mike Fairhead, Gabriel Sama, Pablo Errea or Eduardo Tessler, and also Pablo Ramírez, the other infographics consultant. Maybe the two weeks of my life when I've learned the most.

About the graphics, which is this blog about, here you are some examples of the graphics which are being made at the ET infographics department. InnovAtion idea for teh graphics was, as I hope is seen, clarity, simplicity, as teh marvelous design by Javier Errea. Colors as guide.


In addition, on teh graphics category of teh European newspapers Awards, these have been the winners:
- Svenska Dagbladet (6) Sweden
- Expresso (3) Portugal
- Äripäev (1) Eesti
- Berliner Morgenpost (1) Germany
- Frankfurter Rundschaa (1) Germany
- Het Financieele Dagblad (1) Netherlands
- Hufvudstadsbladet (1) Finland
- Östersunds Posten (1) Sweden
- Presso (1) Finland
- Süddeutsche Zeitung (1) Germany

LIKS
- All Eleftehros Typos issues on PDF and updated daily
- The new at Innovations in Newspapers
- How Eleftheros Typos was (Infographics News)

20/11/2007

Metaphors

Many times, the best way to explain hard data is using metaphors. A " Is like..." that spaniards use to do always with football ("This cricket player is the Ronaldinho of cricket"). Metaphors work very well with health issues. A very good example is the YV series Érase una vez la Vida (spanish title). Thanks to this series many of us who were toddlers were this program was on TV know now how antibodies or white cells work.


With the same idea Fritz Kahn created this poster in 1926, explaining the "man as an industrial palace (seen on Boing Boing). On it is tried to explain the digestive and respiratory systems. The moment it was created the chemichal industry was very strong in Germany, so people were used to industrial issues rather than biological ones. Today, our work has to look for the same idea: find easy referals for complex data. Always with rigor adn being careful for the metaphor npt being modifying the real reference, but explaining and making easy to understand data that other way would be hard to tell. The essence of our job.

12/11/2007

Visualizing classical music

How does a classical music orchestra work?
Is an usual graphic. It's not diificult to find it on cultural publications or when your newspapers helps in the organization of a classical music festival. Is the kind of information without a particular date of publication but always interesting. Today, visiting the always worthy to visit infosthetics, I found this video


It's great. It handle a lot of variables ina very easy way. Time, musicians roles, where are they placed, the presence of each instrument...

Whe it was my time to work on this kind of graphic, two years ago or so, all I could get was this, and I was very proud.


I was just including position and groups. There's always something 1000 times better than yours. On teh most marvelous way.

LINKS
- Project Das Sein und das Nichts

07/11/2007

To Jokela... and beyond

I remember a thread in NAO forum discussing if locators are obsolete. I think sometimes are useless, like this particular example about the Finland shooting uploaded yesterday on Guardian Unlimited. Is really useful to know if the school has a river or a railway near? But it's something that happens everywhere...


05/11/2007

Graphics from the flooding


Lizzeth Huerta, illustrator and infographics artist of the mexican daily Tabasco Hoy has uploaded on her blog 'Pasión por Ilustración' a map of the devastating flood which her city is suffering. It's just the first chapter, cause she has assured that she will upload the rest of the graphics done about the disaster. The following has been a useful map of avalaible servicess.

OTHER LINKS
- Lizzeth on VIsualmente (in Spanish)

World Freedom Atlas

wfa

"The World Freedom Atlas is a geoviualization tool for world statisics- It was designed for social scintists, journalists, NGO/IGO workers, and others who wish to have a better understanding of issues of freedom, democracy, human rights, and good governance. It cover the years 1990 to 2006"

If you want to take a look, do it here