Showing posts with label Comparisons. Show all posts

17/03/2009

Don't use meters, don't use miles. Use blue whales


National Geographic offers on its web this tool to compare length and weight of blue whale with basketball courts, shuttles, planes, people and even triceratops.

Via Fogonazos

12/03/2009

Visualizing really big numbers

Numbers, by themselves, are cold most of the times. And it's hard to get an idea of what they really mean. I remember Xoan G., my first great teacher on this profession, explaining us at La Voz de Galicia an idea: if you say that something have the same area than 200 soccer fields, for me it's just the same that if you tell that is the same than 20 or 2000, the comparison goes beyond human mind (when reading a newspaper) and identifies the amonut as "a lot", with no further complications.

When we really want to explain a really big amount of things, we have two good ways: compare it with just one thing or visualize it as big as it is.
This time, the blog The Big Picture published on Boston.com showed the visualiazation of the 1.400.000 deaths resulting from Khmer Rouge policies in Cambodia. We could compare that number with the whole population of San Antonio, as an example. But they did this (Click on the image to see it full size):


Via Menéame

16/02/2009

Great comparisons. Actual size whales

The only problem that I think that online graphics could have is that showing actual size could be a problem. But the WDCS wants us to see aactual size whale online.I don't know how they made it and I have my doubts about if it's really the actual size. But they really show the idea they wanted to communicate.


Antonio Martínez showed me the link.

Fucking scales! Shit happens in Venezuela too


Nicolás Ramallo sends me this front page of the venezuelan daily Últimas Noticias with the results of the last referendum. You can see the fornt page clean at the left. at the right, marked with red, the size that the 'no' bar should have. Ultimas Noticias wanted the 'Si' (yes), as you may have supposed.

09/02/2009

Fucking scales! Sometimes we're part of the problem

Soraya Sáenz de Santamaría, spanish politician of the Popular Party (opposition), showed this graphic to the press talking about the evolution of the unemployment in Spain.


If you know the data, it's easy to see that the scales don't fit. It looks like there are three times more unemployeds than one year ago. (which is not true).
It's just another visual lie, used so many times by politicians or businees men. If we take a look to the real scale between both bars, the actual difference would be this:


A great difference anyway, with no need of lies. But this is not the first time we see something like this.


And another detail: on both cases (both of the Popular party), they use the blue for the good data (blue is the colorr associated with theire party), and red for the bad ones (used by the socialist party).

But media is not innocent here...We have our own history of lies. On example: for the same data, El Periódico de Catalunya, a newspaper which is against the popular party, published this graphic on the frontpage.


A trick much bigger than the first one. But we (or better said, our editors) use to like the dramatic changes, even when they don't exist.

01/12/2008

Great comparisons (XI). Actual size pengüins

There's no better comparison than that made showing the actual size. That's why VIVA, the sunday magazine published by Clarín (Buenos Aires, Argentina) used four pages to show the reader how big is a Magallanes Pengüin, an animal who lives at the strait of the same name, in Argentina and Chile.


Thanks to Pablo Loscri for the images.

28/09/2008

Great comparisons (X)

Juan Antonio Giner include some great comparisons of ocean liner ships on his blog. The best you can do is to take a glance to all at the link, but here you are one for starting...


Just one thing, sorry for having the blog stopped for some days. I've been at Stockholm for talking at a seminar by CAP & Design magazine. Stockholm has been very interesting, also in the professional field, but I'll talk about that on the next posts...

16/09/2008

All the things I didn't show this weekend: more LHC and great comparisons

After a relaxing weekend in London, I come back to Madrid with work to do. Nigel Hawtin, from New Scientist, send what he made for his magazine about the LHC, as a part of the collection I was making here


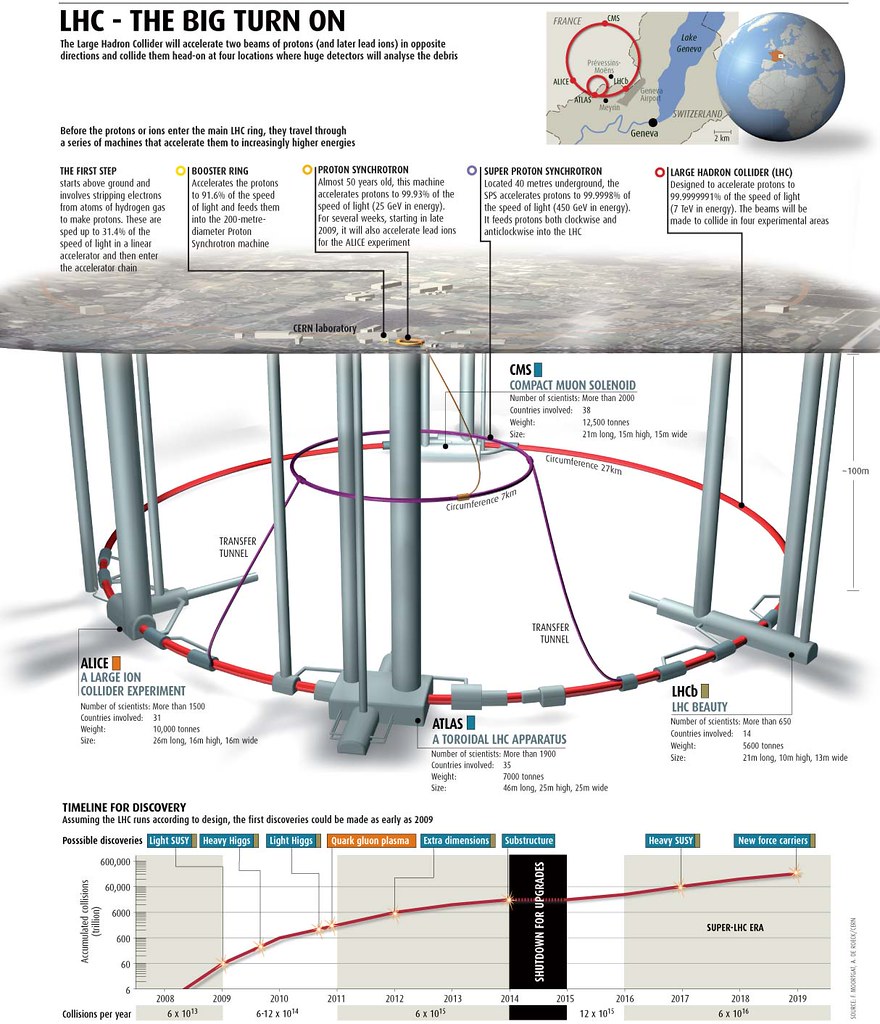
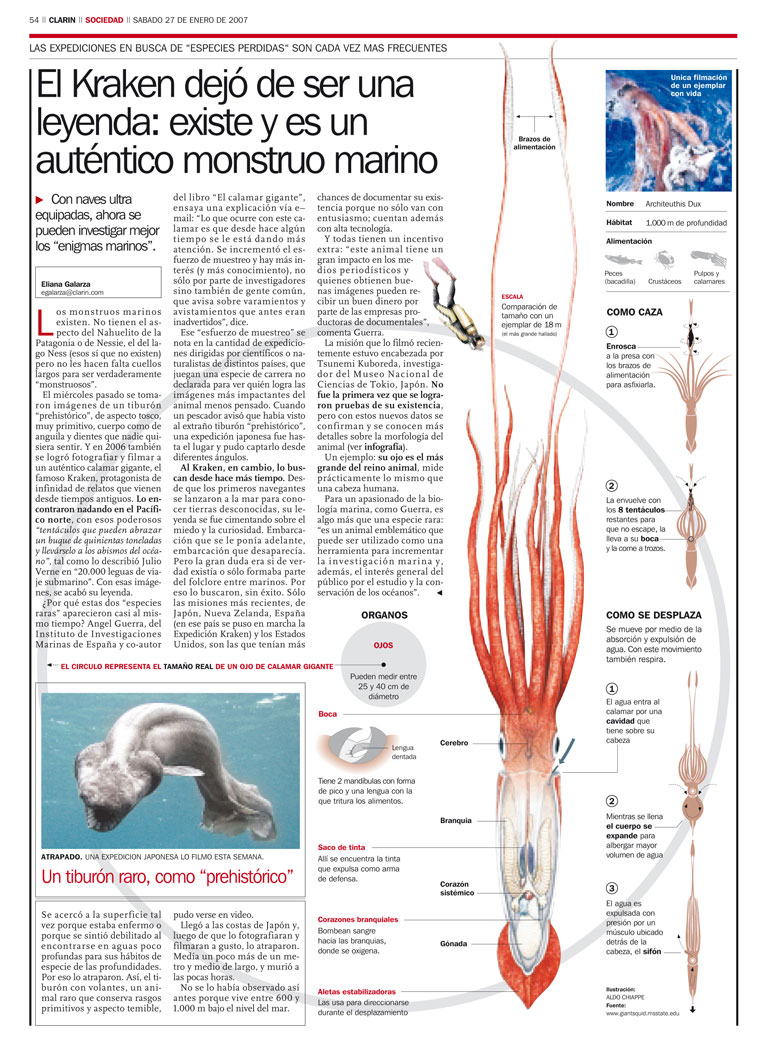
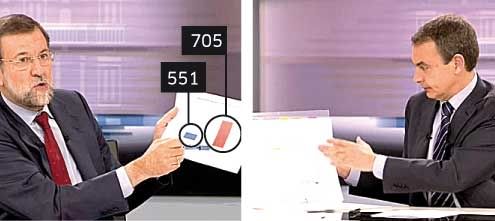
And they're not the only ones, thanks to Pablo Loscri, graphics director at Clarín, we can see the graphics of the argentinian journal about the collider. The first one is old, and it was published as an advance.


The first day they recovered the graphic, making a new bottom.


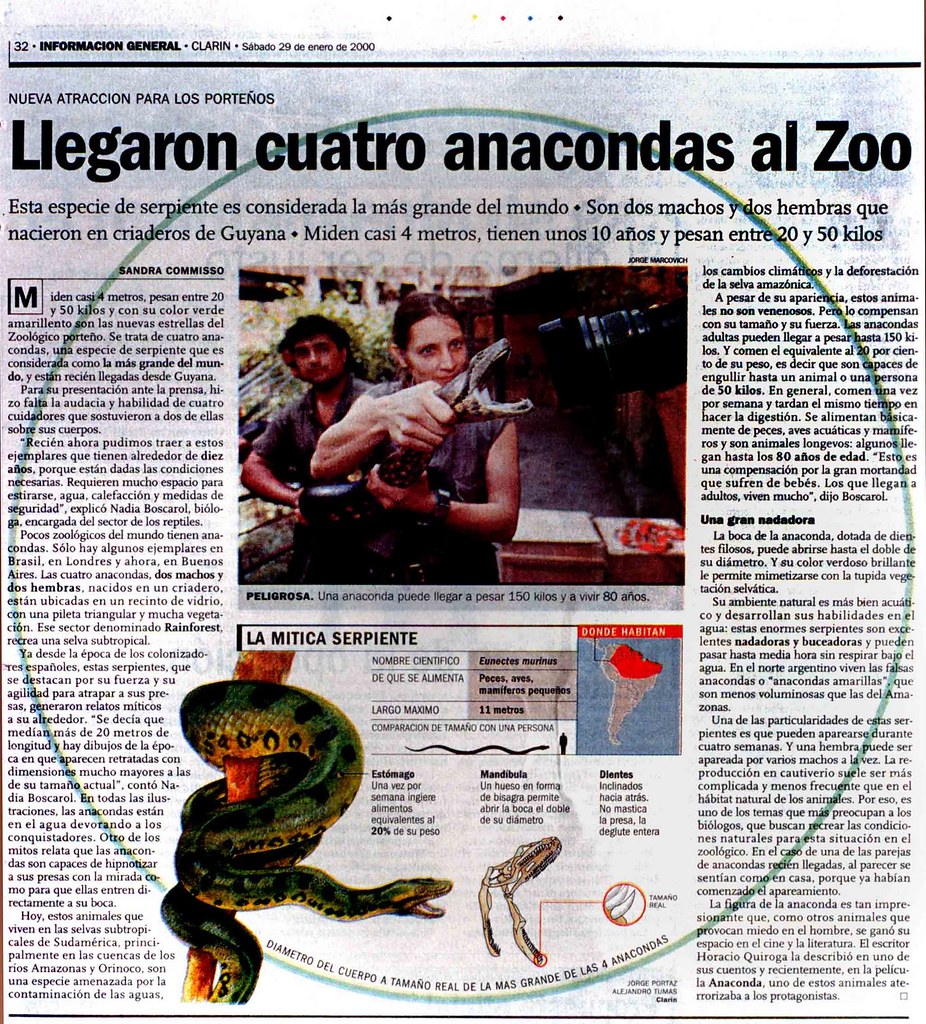
But this is not the only thing coming from Clarín. If you remember the Tumas and and Portaz's graphic about the anaconda you'll find funny how, today the newspaper follows its own style, but with kraken instead of snakes. This time, the circle show the actual size of an eye.


And other great comprsion was found by Guillermo Nagore, one of the greatest designers of the moment, as you can see on his last work. Big pity (for us) that he leaves the news to be Creative Director at Stone Yamashita Partners. But let's go to the comparison. It compares the biggest planes on the world, on a smart, clear and interseting way: so you can see how some are compact and high, and other with a bigger length. Where to find it? On Wikipedia


And, for ending, a curiosity sent by Víctor Caballero about donations to the USA presidental candidates, seen on Pitch Interactive


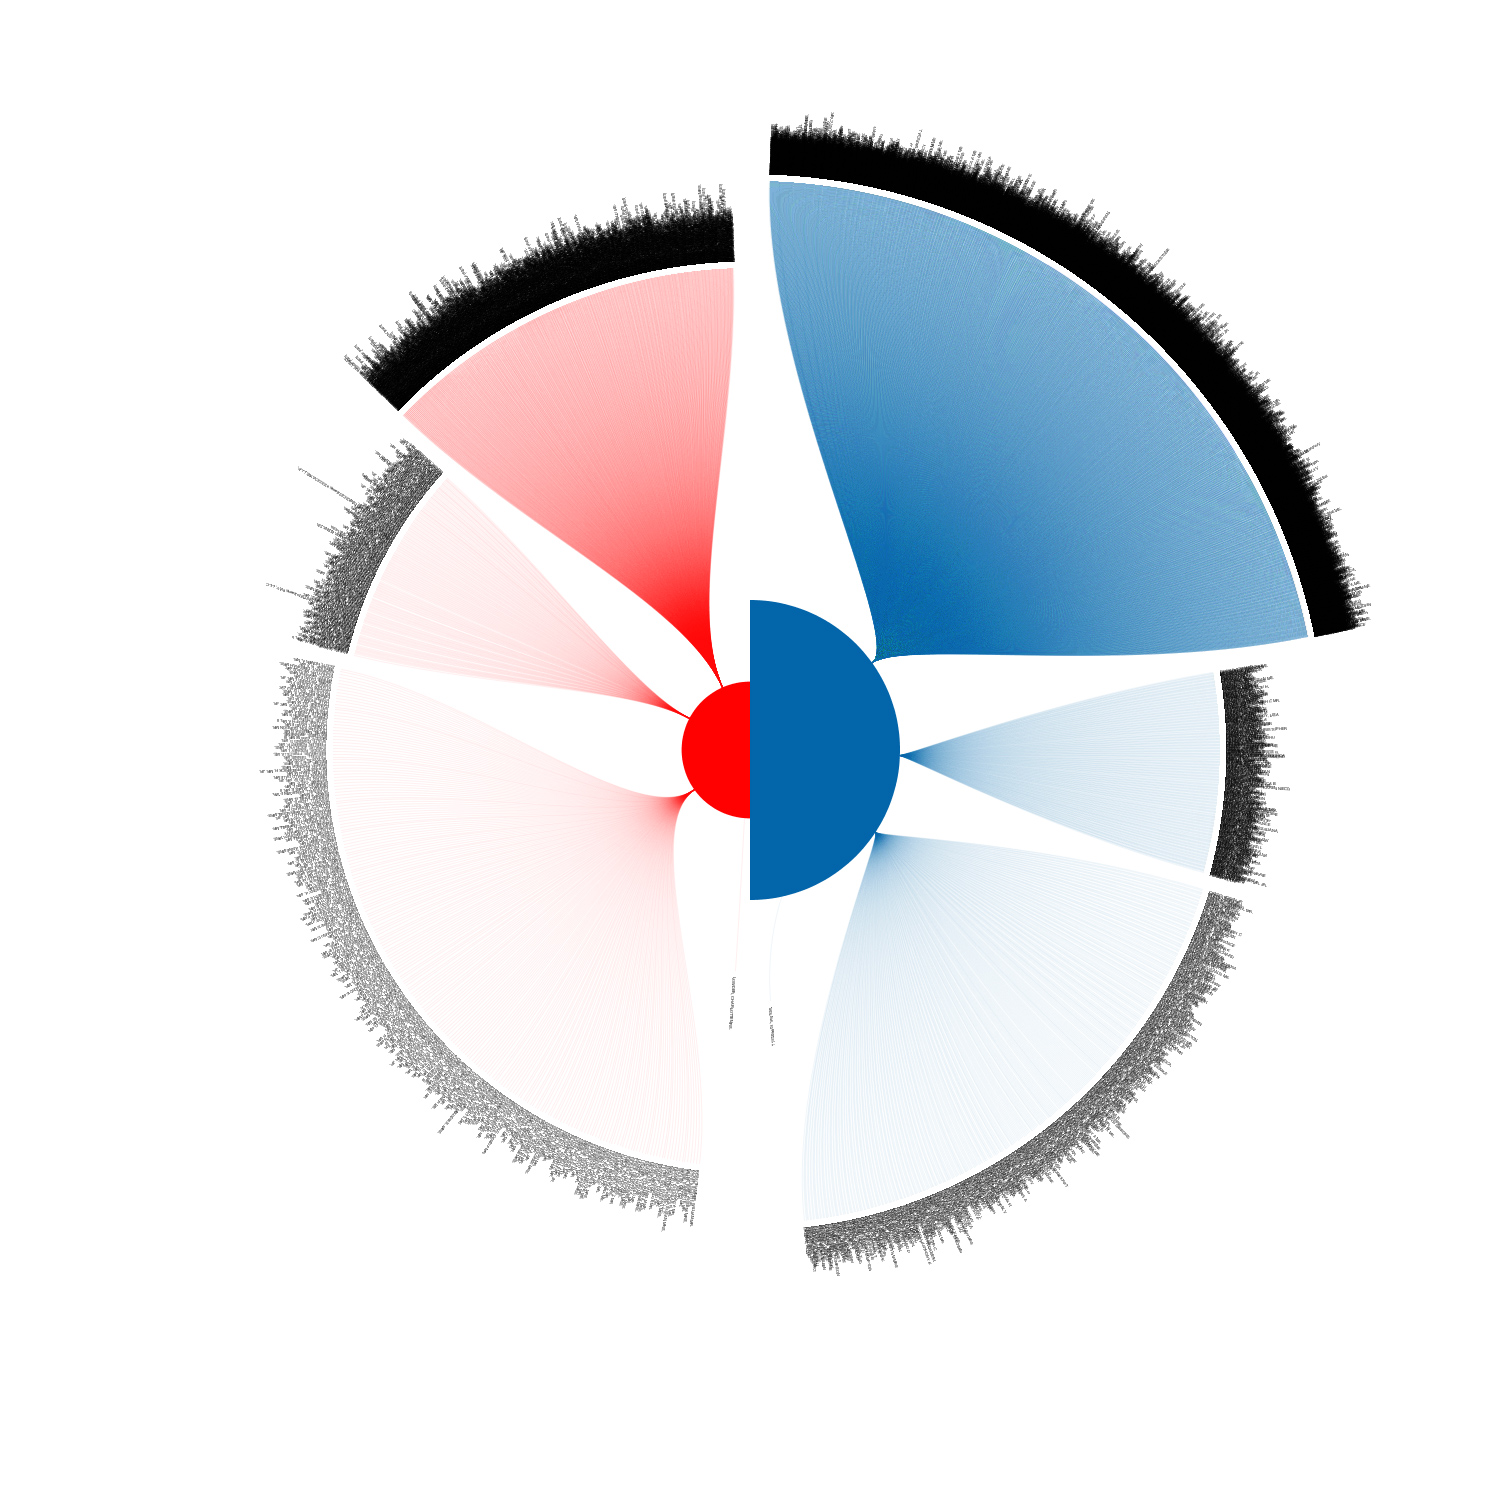
Circles on the centre are the donations to each one (blue Obama and red McCain, as usual). The three 'fans' show the ranges of money donated: the first one shos donations from 1 to 100$, where Obama really wins. It's a hard graphic, maybe too complicated, although it makes the point it wants.

My sixth trip to London was interesting, above all because this time I could really enjoy the city, as I had seen before all I wanted to see. But this will be another post.

10/09/2008

Great comparisons (IX)

I could see on Paper Papers this graphic by Alejandro Tumas (now in National Geographic) and Jorge Portaz published on Clarín.


The circle show the diameter of an anaconda... and it's impressive.
I love this kind of comparisons, and I've used them many times. As for the diameter of the wres of the new bridge of Cádiz...


If comparisons want to show us the actual size of something, there's no best thing than showing the real one.

30/08/2008

Great comparisons (VIII)

I 've been a long time loking for this graphic. One of my favourite comparisons. I finally found it on Cuatro Tipos, and I hope they will forgive me for the robbery.

UPDATE
The always great Gonzalo Peltzer sent me the color page and a detail of the same graphic, so the robbery to Cuatro Tipos is now finished. Many many thanks, Gonzalo!

It's one of Jaume Serra's graphics when he was at Clarín. The sillouethe on the center of the page representents the extension of Buenos Aires. The text inside it explains that the city is in scale with the whole surface of the page, which would be the extension of all the lands owned by Soros, a argentinian millionaire.


It' not unusual to see this kind of graphics nowadays. We ourselves have done 3-4 graphics of the same style on our 12 months of life, but always with this one in mind.

28/08/2008

Great comparisons (VII)

Starships of the main science fiction movies. All of them in the same scale, also with some real starships. The scales is 1 px = 10 m

19/08/2008

Great comparisons (VI)

OK, maybe it's not too fair to clasify my own work as 'great', but I didn't know I would include one of my graphics on this serie... Anyway, a blog has always a bit of 'autoadvertising'...
This is a piece of a bigger graphic about Pluto, but this part is the only one interesting for the serie. We played with a idea. We converted the Earth into a football (soccer) ball. With that size, we converted the rest of planets of the solar system to the same scale. Then, we placed the sun on the Puerta del Sol (Sun's door means the name, a proper place), the main square of Madrid and placed the planets on their orbits always with the scale we said. And this was the result. It looked for us a good way to explain the astronomical distances between planets...


As usual, fiercest critiques are wellcome

04/08/2008

Great comparisons (V)


Silhouette of a town. Middle Ages and Modern Times.
Isotype Institute.1993.

03/08/2008

Great comparisons (IV)

I've talked about these examples before on ths blog, but not inside this new serie. So it's look like a good time to remmeber and summarize them...

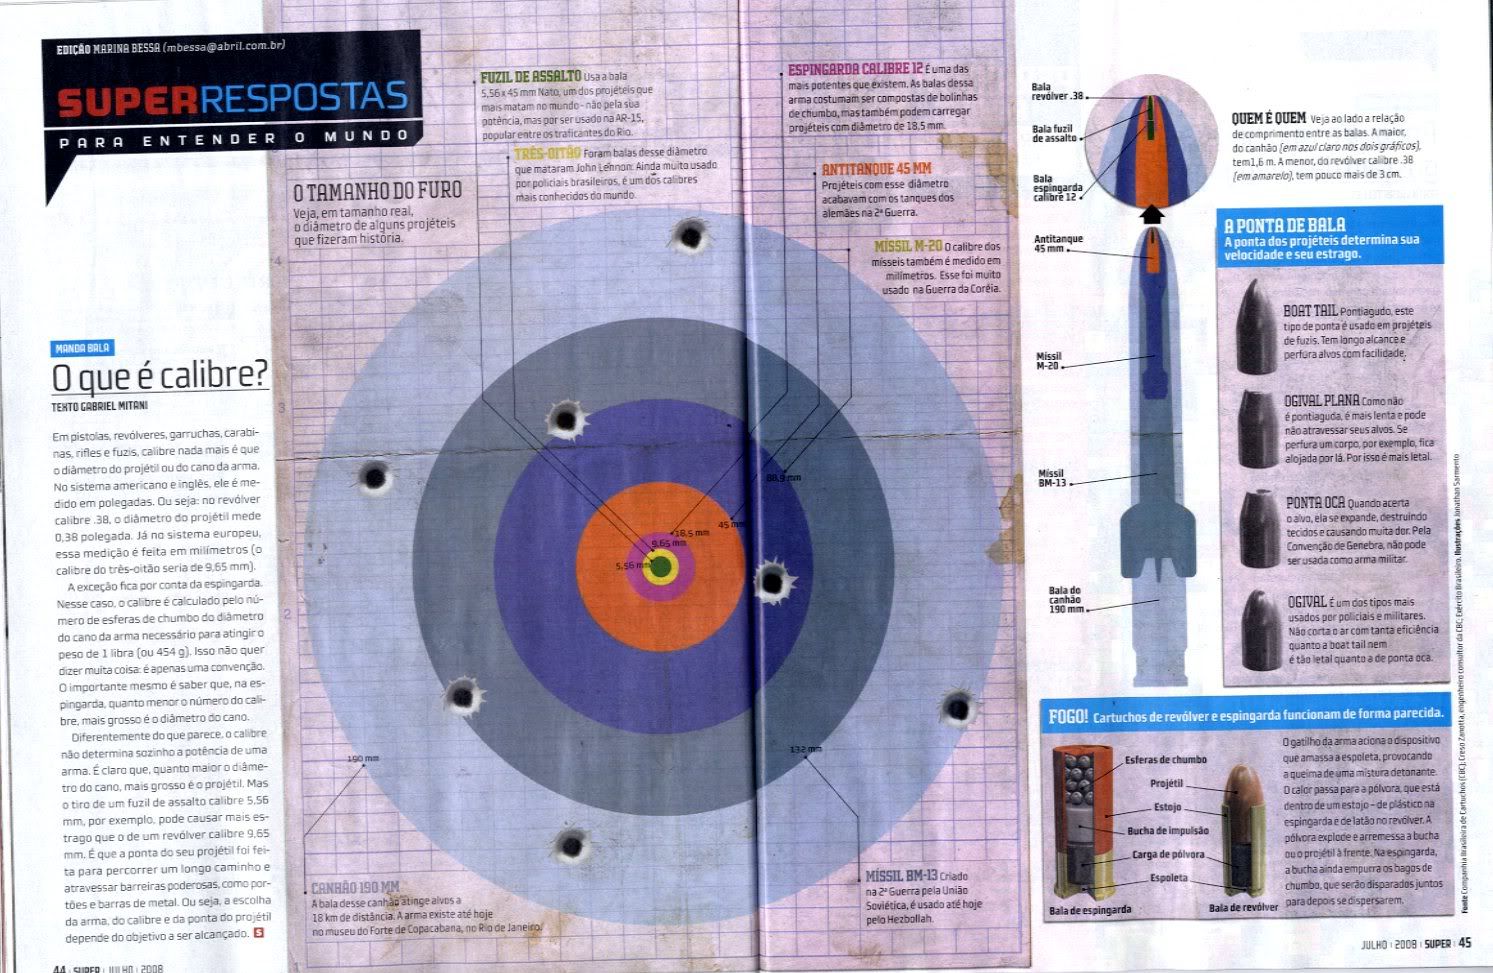
Caliber of different bullets. Actual sizes. Superinteressante (Brazil)

Wiston Salem Journal (USA)

San Jose Mercury News (USA) on the MacBookAir

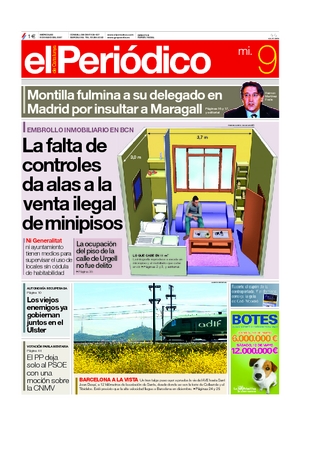
How is living in a 'miniflat'. El Periodico de Catalunya (Spain)

One of my favourites frontpages. The Independent (UK)

All the water and all the air in the world

How far did Armstrong and Aldrin walked on the moon?

29/07/2008

Great comparisons (III)


DPI Comunicación, published on El Suplemento Semanal

One of my favourites graphics of all times. Clear, direct, divulgative. It compares a car crash with falling froma famous building depending on the speed. I mean. Crashing at 220 km/h is like falling with the car from the Empire State Building. A crash at 120 km/h is like falling form the Pisa Tower.

26/07/2008

Great comparisons (I)

Visual comparisons are to infographics what metaphors are for poetry. A very basic but very effective tool. A good visual comparison has infinitely more strength than any cipher just written. The viusla comparison gives context, call the attention over the fact and provides valious information.
That is why I start this series about great comparisons, to demonstrate thatshow is almost always better than tell.


Tim Broderick, Daily Herald.