Yesterday
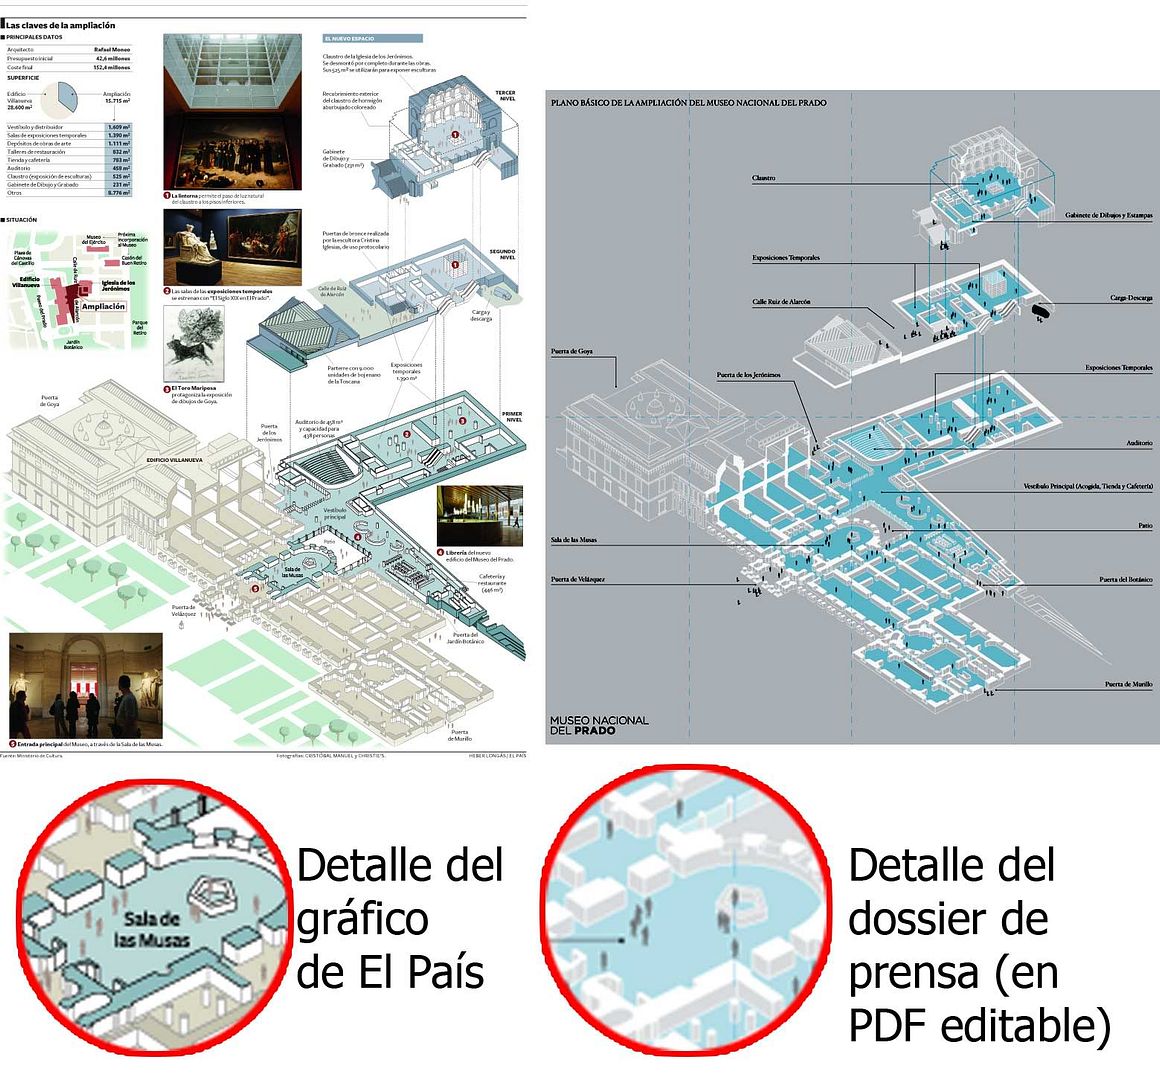
ETA, the terrorist group, assasinated again. The victim has been Isaías Carrasco, former socialist politic on a basque village, who decided to not have bodyguard. He left his home, and once inside the car, the terrorist(s) shot him from outside and escaped. He got out of the car and his wife and daughter run out of his home to find him on the street, bleeding. A while after, he died in the hospital. All this information can be seen on this photo

His home was the one on the center. His car the one wth bullet-holes on the front. His blood, the spot on the asphalt. Mark this information on the photo is enogh for me. But not always, not for everybody.
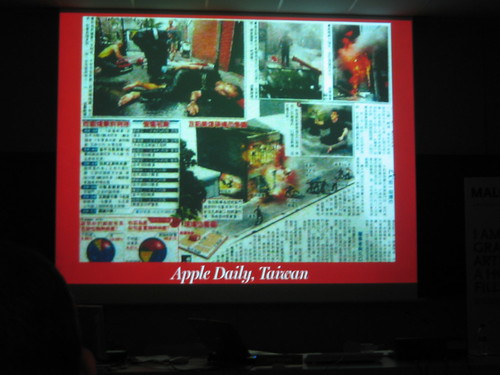
With this kind of terrorists attacks, on newsroom looks like logical and usual to have a graphic. Always. And people want to see it. But there are some 'complaints'
1. The information on how thngs happened change all over the day. And the day after, you can discover how all was other way. Your graphic is, most of the times, obsolete, and liar.
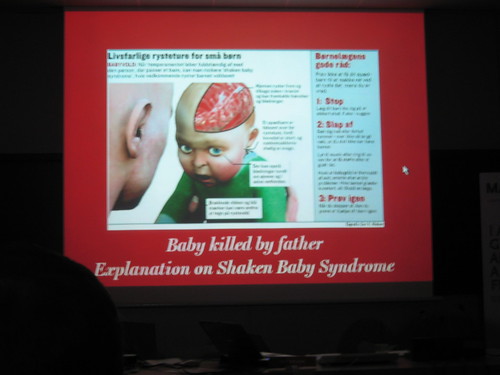
2. Other times, like this one. the important is WHAT happened, much more than HOW. If he was insido or outside the car, if there were 4 or 5 shots, or if he fell after or befre are irrelevant details on such cruelty. And there are just irrelevant details that we can tell on the graphic. And even worse. Irrelevenat details that, most of them, we can't confirm, just suppouse. And we're not talking about a sport match. This have been an assasination.
We tell things we don't know for sure just because we think that people expect to see it. I think the best is just tell what we know for sure. We published at Público the photo from above, marking the spots with the information I told you first. Maybe there are better options, but this has been the 'agreement'.
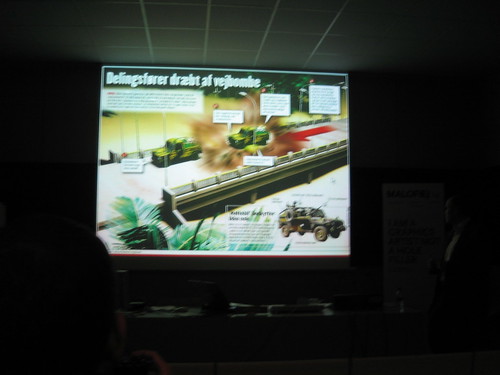
There are always excerptions. There have been terrorists attacks where the HOW have explained WHY. And then HOW is the main thing, and deserves, (except if we don't have real information) a graphic.
As Javier Errea says, 'first rule is no rules'. Let's re-think all what we do just because we're used to it. And more on such delicate topics. What happened? Does a graphic explains it better than a text or a photo? Do we have information? Then, let's do it. No doubts. Always when it makes sense, but not because we're 'used to it'. But all this is just my opinion.