27/01/2008

Similar diversity: religion and infographics


Similar Diversity is an information graphic which opens up a new perspective at the topics religion and faith by visualizing the Holy Books of five world religions. Communalities and differences of Christianity, Islam, Hinduism, Buddhism and Judaism are shown up in this datavisualization.
The visual's basis is an objective text analysis of the Holy Scriptures, and works without any interpretations from the creators' side. Despite - or even because of this abstraction, the artworks are not only working on an informal but also on an emotional level. The viewers should be inspired to think about own prejudices and current religious conflicts.


Thanks to Luis Yujipolo for the information

Similar Diversity webpage


Digg!

25/01/2008

Modern infographics

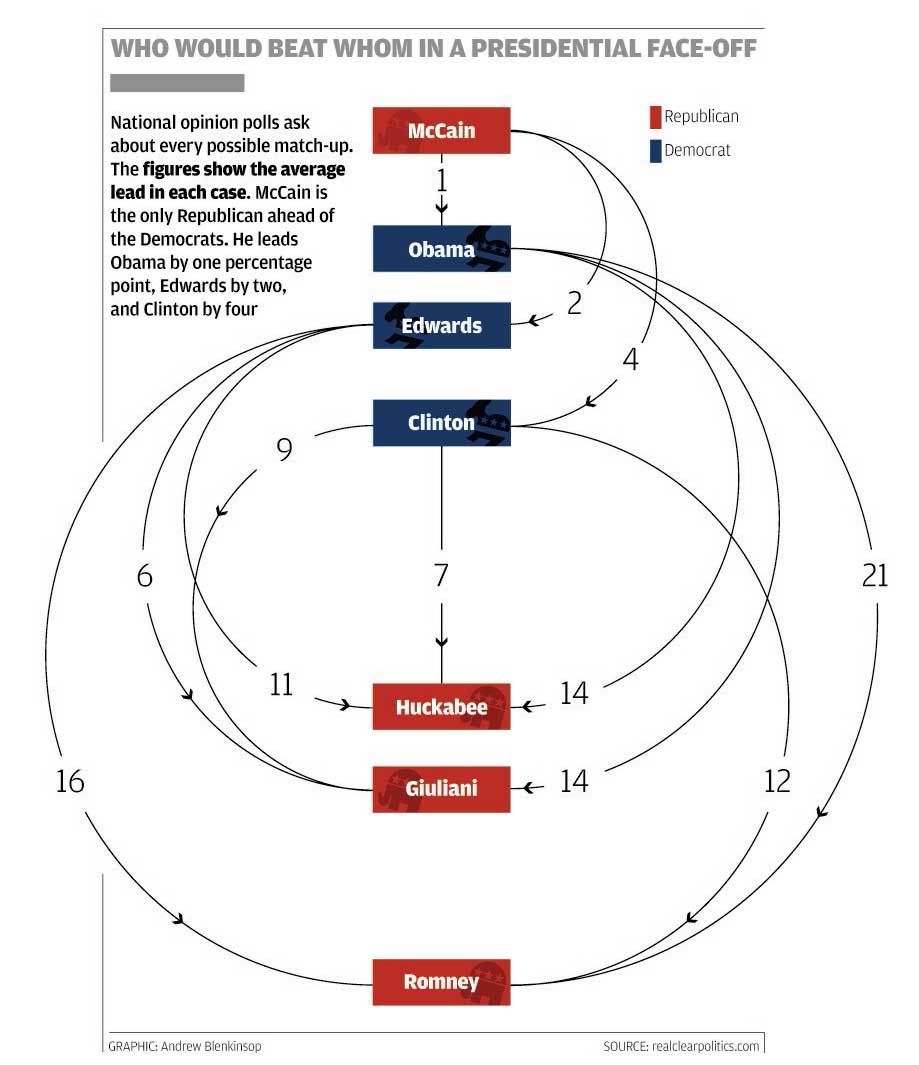
Some days ago, The Independent on Sunday published this graphic about USA elections. It explains the results of a poll bout who would defeat who on a presidential face-off. Each democrat against each republin and each republican against each democrat, and the victory margin.


I have some little problems to understand the key at first sight, but I should put the blame on my english in this case. But, I agree with Michal Agar, chief of infographics at thel IoS, who spok about it with the terms 'modern infographic'. I wouldn't use the word 'modern', but because in spanish it has several connotations, more suitable for fashion than innovation. But I think is a kind of infographics we need now and in the future. It manage to explain, visually, a lot of data, and with order. Maybe the general reader need a little time to get used to it, but people now have a wider visual culture. Of curse, it depends on the topic. Each graphi, topic, country... has it own reader and style. But some news,maybe for their complexity, need a visual system beyond bars, pies and evolutions.
NYTimes.com is in this trend. As Matthew Ericsson, ma of the house, said about online graphics: "You've got t build graphics for both Bart and Lisa Simpson. Lisa will get a lot of information and will take cloncusions, and Bart can play with it".
Newspapers (print) have to offer a plus that internet, radio and TV can't offer. And it could be reflexion. Time. Tv and radio don't have time to get inside the new, analyze it and take a time to explain it. Sit in teh sofa with a graphic and observe all the variables and possibilities is proper pf print. And just internet can be a competitor for that.
Elections (spanish and american) are coming ahead. Good moment to start trying these kind of graphics. Because we have a big bunch of boring data that we have to present on an attractive way, because people want o know about that. Explain hard data on a visual way.

Thanks to Michael Agar

22/01/2008

Does it make sense?


Does this front page make sense?, Is this graphic real? And if it is, does it make sense to publish it without cyphers?
Sometime we complaint that graphics are used just with an sthetic intention, instead of thinking on the information?. Well, this is not the case. No sthetic. No information. No sense.

21/01/2008

Things I've not talked about these days and worth a look

I've been disconnected for some days. Free days and a mother visiting me are the reasons. Today, at coming-back-to-job Eve, I've been taking a look o the web, and I've seen some things worthy to have a look.

Heathrow crash-landing posts at Innovations in newspapers

Great ocassion to see how british newspapers reacted to such an 'infographicable' new as the crash-landing of a Britih Airways plane in Heathrow. Juan Antonio Giner, has been following this information on several posts step by step:
1. The story of the day: A miracle in Heathrow Airport
2. A British Airways ad not in the best place
3. More London crash-landing graphics
4. British Airways emergency evacuation: A world record?
5. 'Busy' infographics
6. The crash landing. Up or down?
7. BA grouds staff "passenger's sxpectations"
8. The BA crash landing and what readers say

Six Less-Than-Helpful Infographics

Reading Alberto Cairo's blog I ould discover this article about graphics that don't exactly help. Funny and, sadly, true. And worst is that several people with responsabilities on newspapers think these are great examples of what they would want for their newspapers.

Priorities
That is what happens when we think that th importance of a new is the clue to make a graphic, withot thinking if the information needs a graphic to be explained.To acess the online graphic, click on the image

16/01/2008

Compare, compare, compare


Explaining dimesions is easy if you find an everyday object to compare with. It helps people to make their mind about the actual size. Better than numbers. Is easy and it communicates. This example appeared today on The San Jose Mercury News

Via Innovations in Newspapers

12/01/2008

Worth a thousand words

Those are the words used by The Economist to choose the three best charts in history:


DIAGRAM OF THE CAUSES OF MORTALITY IN THE ARMY IN THE EAST


Farr was the first to compile “mortality tables”, listing causes of death in the general population; Nightingale compared his numbers with her own on the deaths of soldiers to great effect. By showing that even in peacetime a soldier faced twice the risk of dying in a given year as a civilian, she campaigned successfully for better conditions in barracks. The pair were instrumental in setting up a royal commission of inquiry into sanitary conditions during the Crimean war. (...)
The chart displays the causes of the deaths of soldiers during the Crimean war, divided into three categories: “Preventible or Mitigable Zymotic Diseases” (infectious diseases, including cholera and dysentery, coloured in blue), “wounds” (red) and “all other causes” (black). As with today's pie charts, the area of each wedge is proportional to the figure it stands for, but it is the radius of each slice (the distance from the common centre to the outer edge) rather than the angle that is altered to achieve this. Her principal message—that even during periods of heavy fighting, such as November 1854, far more soldiers died from infection than from wounds—can be seen at a glance. She sent the chart to the War Office; and it is a fair assumption that it contributed to the improvements in military hospitals that she brought about.
Nightingale's chart is a beautiful and persuasive call to action, but it is not perfect. The red, black and blue wedges are all measured from the centre, so some areas mask parts of others. The numbers of deaths from the various causes are not stated—although, to be fair, it was their relative size that Nightingale wished to show.


NAPOLEON'S RUSSIAN CAMPAIGN OF 1812


It was drawn half a century afterwards by Charles Joseph Minard, a French civil engineer who worked on dams, canals and bridges. He was 80 years old and long retired when, in 1861, he called on the innovative techniques he had invented for the purpose of displaying flows of people, in order to tell the tragic tale in a single image. (...)

Minard's chart shows six types of information: geography, time, temperature, the course and direction of the army's movement, and the number of troops remaining. The widths of the gold (outward) and black (returning) paths represent the size of the force, one millimetre to 10,000 men. Geographical features and major battles are marked and named, and plummeting temperatures on the return journey are shown along the bottom.

The chart tells the dreadful story with painful clarity: in 1812, the Grand Army set out from Poland with a force of 422,000; only 100,000 reached Moscow; and only 10,000 returned. The detail and understatement with which such horrifying loss is represented combine to bring a lump to the throat. As men tried, and mostly failed, to cross the Bérézina river under heavy attack, the width of the black line halves: another 20,000 or so gone. The French now use the expression “C'est la Bérézina” to describe a total disaster.

In 1871, the year after Minard died, his obituarist cited particularly his graphical innovations: “For the dry and complicated columns of statistical data, of which the analysis and the discussion always require a great sustained mental effort, he had substituted images mathematically proportioned, that the first glance takes in and knows without fatigue, and which manifest immediately the natural consequences or the comparisons unforeseen.” The chart shown here is singled out for special mention: it “inspires bitter reflections on the cost to humanity of the madnesses of conquerors and the merciless thirst of military glory”.


COMPARISON BETWEEN WHEAT PRICES AND WAGES


The chart to the left is the earliest of our three. It was published in 1821 by William Playfair(...) Playfair liked controversial topics. He drew a chart comparing tax levels in various countries in order to show that Britain's was too high. He was the first to show imports and exports on one chart, shading the area between the two to indicate the balance of trade and explaining that the intersection of the lines showed a shift in favour of one country or the other.
This chart, his most famous, shows the “weekly wages of a good mechanic” and the “price of a quarter of wheat”, with the reigns of monarchs displayed along the top. It is a little difficult to see the point Playfair wished to make: “that never at any former period was wheat so cheap, in proportion to mechanical labour as it is at the present time”. Presumably he was not familiar with the idea of combining two variables—prices and wages—to make a third—affordability. Still, he should not be overly criticised for this. For a start, his conclusion was correct. Statisticians have used his data to plot wages divided by prices (showing how much wheat a week's wages would buy) against time, and the point becomes clear—as, incidentally, does a more subtle one: the increase in buying power was slowing down.
And Playfair was already making a leap of abstraction that few of his contemporaries could follow. Using the horizontal and vertical axes to represent time and money was such a novelty that he had to explain it painstakingly in accompanying text. “This method has struck several persons as being fallacious”, he wrote, “because geometrical measurement has not any relation to money or to time; yet here it is made to represent both.”


I don't know if these are the three best charts in history, but they opened new ways to data visualization, and showed how graphics can be very useful. And not just for newspapers.

10/01/2008

Clearer, impossible


All the important data to understand the results on New Hmpshire. Simple, clear and without fireworks.
Another graphic of the (usual) great work that NYT is doing with caucuses.

Seen onInnovations in Newspapers

07/01/2008

Improving copy by copy


The New York Times has published another graphic about last year american soldiers casualties in Iraq. An improved version of the controverted graphic published by themselves and The Independent.


At the end, copy by copy the graphic has improved. I don't know if The New York Times ever knew about the graphic published by The Independent, but they have seized the details that the english paper used to make the graphic more easily understandable: the color. Trtuth is that this data (casualtis by date at the last year) are easier to organize, but, in my opinion, color has given the graphic a new dimension, creating another information layer in such easy and basic way. Simple ideas. They work.

04/01/2008

When size matters


This is today's front page of The Independent.

Aprt from if it's "beautiful" (there's no more subjective matter) or if we're interested on the topic or not, the red stroke showing the actual size of the cage gives this information a great strength and make information more understandable. Just a visual detail, but it worths the whole page

03/01/2008

Good beginning


Returning to the office can be hard, so let's start the year with some laughs. In this video (3.05 min) you can just take a look to what happens when you're working and thinking about other matters... It's in Spanish, but I think this would be a good Show Don't Tell!