First of all, sorry for the delay. The internet conection at Pamplona was just utopic.
FIRST AWARDS FOR FIRST STEPSSorry for the 'autopromotion', but this time I have to seize the opportunity.
One gold, two silvers and 3 bronzes for Público (Spain), having launched the newspapers at September 26th of 2007, made us to be more than glad. The big one was the golden medal for the graphic about the judgement for the bombings of March 11th at Madrid.
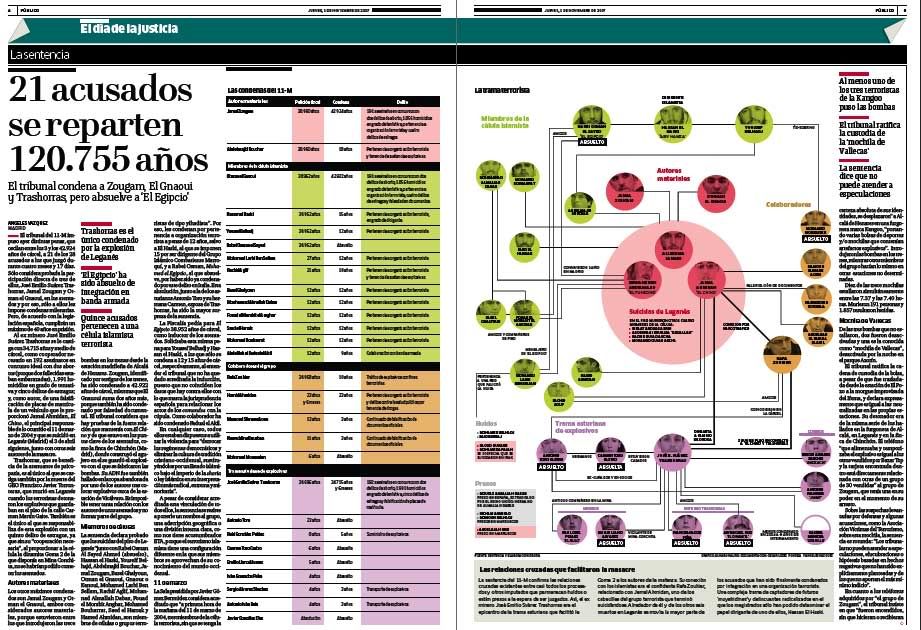
The terrosrist plot.Álvaro Valiño
Dos platas, una por portfolio de reportajes y otra por los gráficos que contaban como transcurrió la carrera de F1 al día siguiente. Y tres bronces, por 'Quién es quién en los boxes', 'El mapa real del SIDA' y 'De dónde viene y a dónde va el dinero del Estado'
Our department is formed by Álvaro Valiño, Miriam Baña, Ana Landi and myself. 30 years the eldest. And we had help from Jorge Doneiger and Pablo Loscri (Clarín), as consultants for the launching.
Now come the pressure to demonstrate that this is not just one lucky day.
NYTIMES.COM, THE BIG ONEOn the year of 'balls' graphics, its big representer got the Peter Sullivan award, the biggest award of the show. And it wasn't with a graphic made with balls, but for
the coverage of Virginia Tech Massacre.
Is a superb job, but I still prefer
'Buy or rent'.
THE CONFERENCESI'll be uploading the conferences, not complete, but as long as I could. I won't upload all together, but one for day more or less.
THE AWARDS1. NYtimes.comPeter Sullivan Award- Georgia Tech Massacre
3 golds, 5 silvers, 5 bronzes
2. The Guardian2 golds, 1 silver, 1 bronze
3. National GeographicM. Urabayen award for the best map - Live still at risk
1 gold, 2 silvers, 5 bronzes
4. Público (Spain)1 gold, 2 silvers, 3 bronzes
5. Newsweek.com1 gold, 1 silver, 3 bronzes
6. Expresso1 gold, 1 silver, 3 bronces
7. The New York Times8 silvers,2 bronzes
8. Clarín4 silvers, 7 bronzes
9. Aventuras na Historia2 silvers, 4 bronzes
10. Fortune2 silvers, 3 bronzes
10. Consumer.es2 silvers, 3 bronzes
12. Superinteressante2 silvers, 1 bronze
12. Golden Section Graphics2 silvers, 1 bronze
12. KircherBurkhandt GmbH2 silvers, 1 bronze
14. Washington Post2 silvers
14. Portfolio.com2 silvers
16. El Mundo1 silver, 3 bronzes
17. elmundo.es1 silver, 2 bronzes
18. Folha de Sao Paulo1 silver, 1 bronze
18. Diario de Sevilla1 silver, 1 bronze
20. El Universal1 silver
20. The Seattle Times1 silver
20. Clave1 silver
20. ElTiempo.com1 silver
20. BBC.co.uk1 silver
20. Semanario Económico1 silver
26. Stern3 bronces
26. The Dallas Morning News3 bronzes
26. As3 bronzes
26. Público (Portugal)3 bronzes
26. Marca.com3 bronzes
31. ABC2 bronces
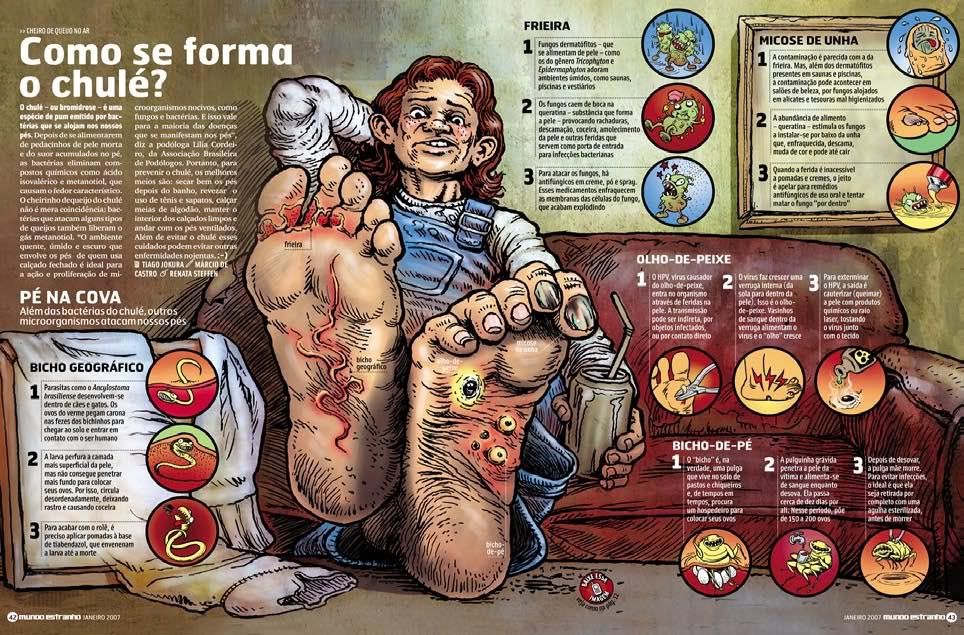
31. Mundo Estranho2 bronzes
31. Marca2 bronzes
31. ABC2 bronzes
35. La Crónica de León1 bronze
35. La Tercera1 bronce
35. Ashasi Shimbun1 bronce
35. La República1 bronze
35. MCT Graphics1 bronze
35. La Voz de Galicia1 bronze
35. Delovoy Peterburg1 bronze
35. XPLANE1 bronze
35. The Sunday Oregonian1 bronze
35. The Oregonian1 bronce
35. Saude1 bronze
35. Svenska Dagbladet1 bronze
35. Nova Escola1 bronze
35. La Gaceta de los Negocios1 bronze
35. O Globo1 bronce
35. Guardian Unlimited1 bronze
35. Hiru.com1 bronce
35. ElComercio.com.pe1 bronce
35. Nepsazasblag1 bronce
35. ELPAIS.com1 bronce
35. EITB24.com1 bronze
35. EMOL.com1 bronze
35. Último Segundo1 bronze