29/06/2007

Dates and first lecturers for Estepona

In its fifth year, Estepona, a little city in the southern spanish coast, will host theWorld Summit of News Design, organized by the mexican consultant Guillermo Gómez Hill. It will take place 27th and 28th september of this year adn some lecturers are already confirmed:
- Rodrigo Fino, from García Media, Argentina
- Juan Durán, Diario de Hoy, El Salvador
- Claudio Rodríguez, dUNAM México
- Orlando Romero, Gramma Internacional, Cuba
- Miguel Ángel Gómez, Gulf News, Dubai
- Miguel J. Buckenmeyer, one of the creators of El Economista
- Marco Gatica, El Mercurio Chile
- Jaume Serra
- Norberto Baruch, El Norbi, from VisualMente
- Javier Sicilia
- and myself...

El Norbi has already uploaded the poster of the Summit on his blog Visualmente

28/06/2007

Quotes

Some interesting quotes I have read on the blog Communication nation by Dave Gray

Marcelo Valoncini, graphics editor at RCS, gives fives secrets of the curious infographics

1. Look forward
Don't stop with the news, simply reporting what has occurred.

2. Reach out.
Don't be shy; call people and ask for details.

3. Watch TV
Look to the television medium for ideas and particulars.

4. Compare elements
Even if they seem absurd at first, comparisons help people understand things in a larger context.

5. Use the internet
It can deliver strange, funny or useful elements to enhance your story.

Juan Velasco, graphics editor of National Geographic, explains what is an infographic

1. It's a visual explanation that helps you more easily understand, find or do something.

2. It's visual, and when necessary, integrates words and pictures in a fluid, dynamic way.

3. It stands alone and is completely self-explanatory.

4. It reveals information that was formerly hidden or submerged.

5. It makes possible faster, more consistent understanding.

6. It's universally understandable.

26/06/2007

The Independent: how to use graphics on front pages

I've talked several times on this blog about graphics as main illustration of the front page. Something I support, as an option, because of the possibilities of graphics for explaining the information at first sight. There's a "fear" about using big infographics on front pages, and sometimes editors use photos as if it was an obligation.
One of the newspapers which has the best use of infographics on A1 pages is The Independent (and its sunday edition The Independent on Sunday). They show their opinion and clear facts just taking a look to its cover.
And, as this is a visual journalism blog, Show, Don't Tell! Here you are a slideshow with the "infographic" front pages of the last 12 monthss.


If you want to take a look to all The Independent front pages since march 2006, click here

25/06/2007

The best side of online videos

I must confessed I have "attacked" online videos for "usurping" the place of online graphics in informations which need a better visual explanation
In other hand,the sad news that came yesterday from Lebanon made me "re-think" the question, and have a look to the benefits they bring for online graphics. The information of some spanish soldiers dead were fisrtly accompanied by some comments about a mine. Finally, we could know the cause was a bomb in a car. But this was much later. One or two years ago, I culd have imagined the people from elmundo.es or ELPAIS.com having to do a graphic when they don't have much information. Today, this thirst of havinf "something moving" is calmed by video. It does not have to be so specific, so it have not to "lie" telling information we don't really know and editors got what they wanted. All we win. Readers too.

UPDATE
Just a minute after posting this comment, I visited ELPAIS.com and saw how they have uploaded an online graphic about the new. Showing all the details. I should better shut up my big mouth.

21/06/2007

Visual language

If design and graphics are "visual languages", chinese also. Here you are an example:


Not because I speak chinese I can tell you that this means: Forest + Flame = Fire
But, with a little of iamgination, you can see it yourselves:

This character is mu (wood) means tree and, its shape could have a remembrance to one of them.

This is lin (forest), and it's just to "mus" together. Logical.

Huo means flame, and looks like one (OK, you need some perspective)

And if we add a flame to the forest we got... Fen, which means "burn" or "fire".

Via ChinoChano

China becomes the pollution champion


Some days ago we woke up with the newspapers telling us that China has passed USA as the world biggest CO2 emitter. This page has been yhe best I've seen about that topic, and I've not read a letter. Direct and visual.

Great graphic from our colleagues from Heraldo de Aragón, published on their blog Caja de Imagen

The other side of the maps

Most of us have maps and locators making our days. So, you better visit the blog Strangemaps to stop hating them and discover the other face of maps beyond shapes, rivers and locators. Some theorics say maps are not infogaphics, but some of these really are: they explain.

Some examples
This USA map shows different names of countries inside its states, comparing de Domestic Gross Product of each state with the one of the country written. California as France, Michigan as Argentina or New Jersey as Russia.
Could it be just a table? Maybe, but then it won't be shown here!


EMaybe you know this one, it appeared at The Guardian A1 months ago. Shows the Europe climate map at 2071, and how some eruopean cities will change their temperatures comparing with nowadays ones.


And this one it's not an infographic, but it's also a good reason to take a look to this blog

18/06/2007

Risky bussiness?


Big infographic A1s, betting for soemthing different than a typical elections victory photo (the safe? way) arrives to french traditional media. In Europe, just a few "dare" to publish this A1s (with the honourable exceptions The Independent and El Periódico). Anyway, when you see the papers in the morning... What cover would you choose? Le Figare ore these ones?


Via Innovations in Newspapers

15/06/2007

Design 2.0


As Paco Oca published in his blog Maquetadores, he have a new miracle product just for 1.750 $, and you can save all the design department budget. I know some owners that I would prefer never will see this...
This product ( access to its web clicking here) promise that, anyone, with two basic ideas can design a newspaper.

I just can't believe that... It looks like a marketing campaign for InDesign creating a sort of big urban legend and then offer the real solutions with his new version... But the world is full of nuts...

New design Messiah and his ¡7! years of experience promises us taht these templates will give great design for small newspapers, doesn't matter if all have the same kind of pages.
But, we don't need it. We got this with templates from Publisher. We don't need photographers, we got banks of free images in internet. We don't need infographics artists. We got Clip Arts form Corel.

Some papers, where the really important thins is reducing costs and not getting a good product, could fall in this non-sense. Nobody with a minimum of common sense would buy it, but... you never know... I'm scared...

13/06/2007

ÑH04 call for entries


No place or dates confirmed (although it will take place at autumn, as usual), but you can start sending entries for the next ÑH04 (PDesign and infographics awards for Spain and Portugal) organized by the Spanish chapter of the SND. Deadline is september 7th, so you have a long time.
You can download bases here.

We also have dates for the next Malofiej Awards: March 9th-14th, 2008., in the University of Navarra, as usual.

More information, at the spanish chapter of the SND.

12/06/2007

Life of a graphic

Óscar Corvera, infographics artist from La Prensa Gráfica (El Salvador), sends this interesting document about the steps given to make one of his breaking news graphics and other following the facts, a great example of how an infographic artists can (should) work as a journalist.
I'll let him speak:

HOW I MADE THIS GRAPHIC


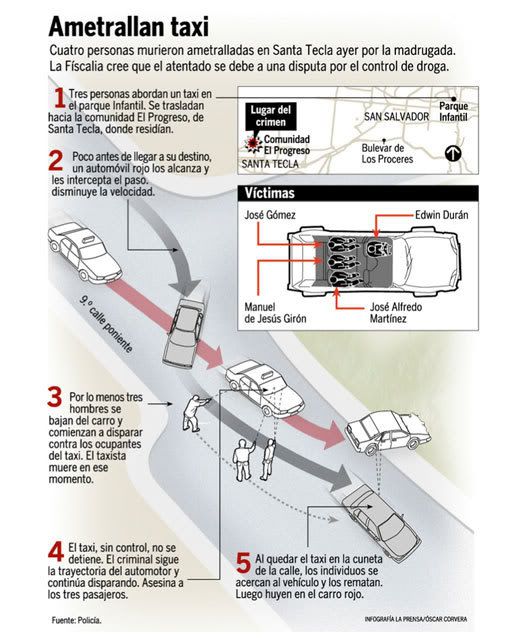
I receive call at dawn from my boss, telling thata car was shot, and there are some dead people.
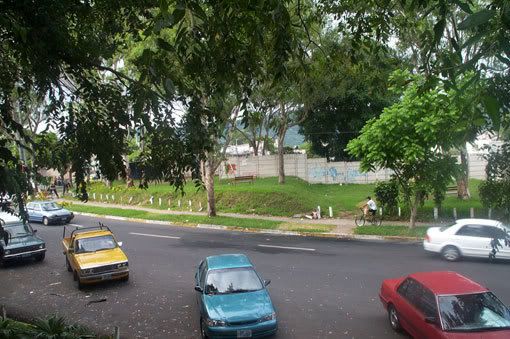
Sketches
I go to the place and start to research information, from witnesses and policemen, telling me what happenedM
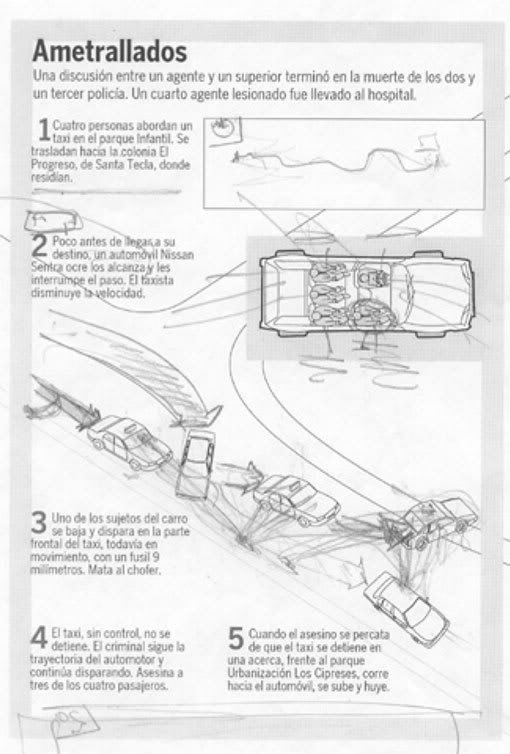
I've got to focus on one of the testimonies, make sketches about how the robbery happened, the street, cars, trees, deads...
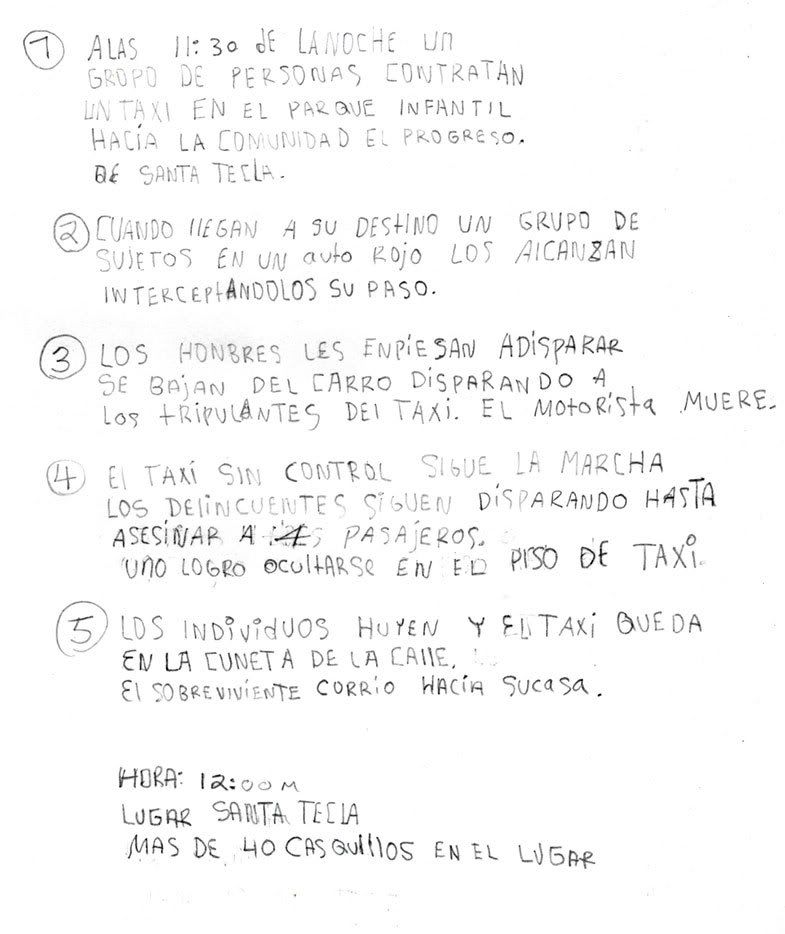


Notes
I collect all the information and write the crime step by step.
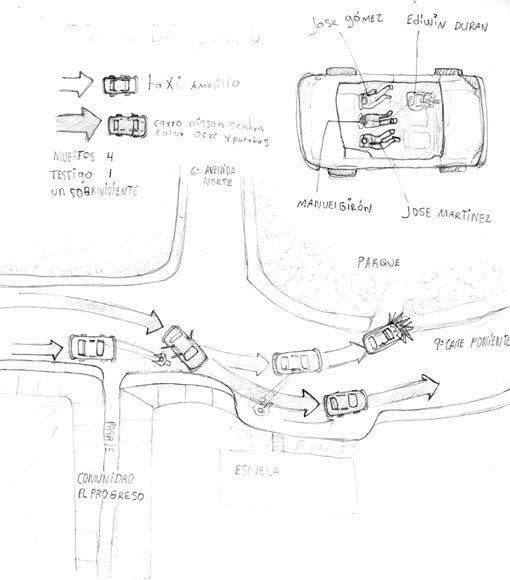


Final sketch
I get the space in the page with designers. Graphic data is collated with the article to handle the same version.
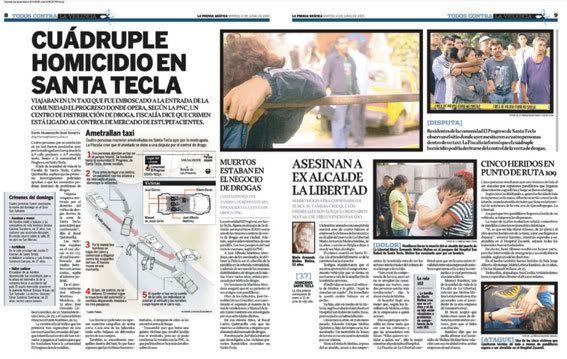


Final work
After writing the texts and work with the images, graphic is just reviewed by correctors. Finally, the graphic gets into the page.
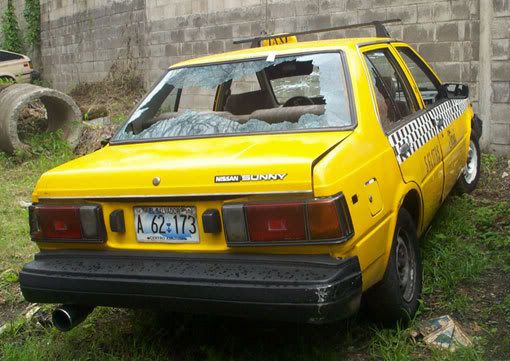
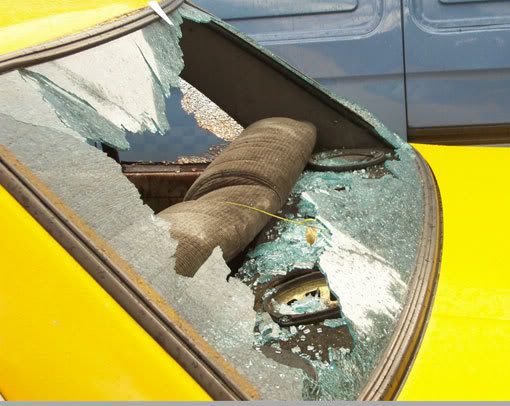


Following the news
After the fist publication, I decie to keep investigating. I asked sources from police and office of the public prosecutor. I visited the place of the crime and studied it. Finally, I got in the palce where the shot car was in custody. I counted the bullet holes and their positions. With help from the investigators I reaffirmed the palce where the victims were and reconstructed the version of the witness.


Publication
The infographic made the editors to choose a journalist to write an article to go with it.
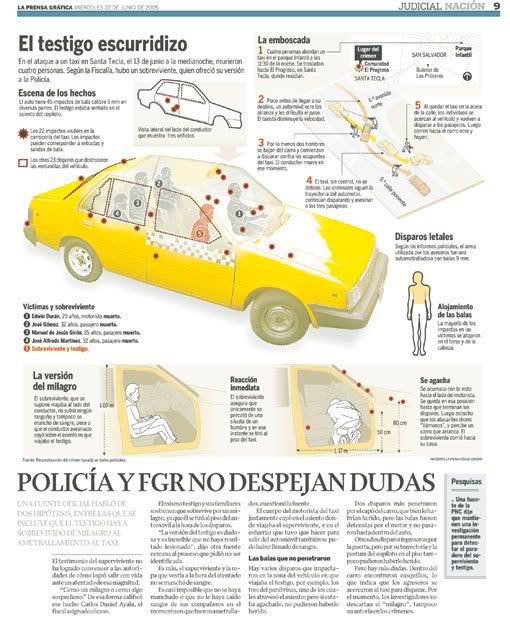


Award
The graphic was sent to an international contest, and got an Excellence Award (SND).

11/06/2007

Graphics avoiding boring

An article about the problems with our hometown public WCs doesn't look, at first sight, as an attractive information to spend your time reading. And not many people would make a graphic out of this. But The Boston Globe made it. Javier Zarracina (a classical in Infographics News) and Joan McLaughlin bring us this graphic:


It has everything: it's funny and call my attention, now, I would read now the article. It has reporting, telling what happens during three hours at one particular public WC, and showing how it goes out of work continuously. It has, as Zarracina says, a liitle homage to NYT using circles on the map as chart. No 3d, no spectacular illos. But it works. And very good.

Winners of the NAO Quarterlies Q1 2007


Last friday Layne Smith announced the winners of the first edition of NAO Quarterlies, the free and trimestral competition,, with winners selected by popular voting.
The resulst had The South Florida Sun Sentinel as the most awarded newspaper, with three awards, including best graphic of the show. Alberto Cuadra, from Houston Chronicle was the only artist with more than one prize. Nélson Fernández, from Panamá América was the ony infographics artist from a not-USA paper awarded.

You can take a look here to the gallery of awarded graphics

Los elegidos de este trimestre han sido:

- Best graphic: Superbowl XLI (Hiriam Henríquez, South Florida Sun Sentinel)
- Honorable mention: Jamestown (Phil Loubere, The Orange County Register)
- Best mapa: Journey from Africa (Belinda Long, South Florida Sun Sentinel)
- Best big graphic:Inside the bayport complex (Alberto Cuadra, Houston Chronicle)
- Best small graphic (less than half page): Inside Mayor Fenty's Bullpen (Todd Lindeman and April Umminger, Washington Post)
- Best chart: Congress changes Hands (Laura Stanton and Karen Yourish, Washington Post)
- Best 1 column graphic:Flamingo Dance (Troy Oxford, The Dallas Morning News)
- Best use of wire graphic: Las distintas partes del Skate (Nélson Fernández, Panamá América)
- Best multimedia graphic:A census of life (Cindy Jones-Hulfachor, South Florida Sun-Sentinel
- Best interactive graphic:Road referendum (Jason Lebke, Margo Pearson and Chris Soprych, Rockford Register Star
- Best on-line graphic:Teasers and justice (Alberto Cuadra and Rodrigo del Castillo, chron.com
- Best illustration:iPod (Josh Rutnick, Contra Costa Times)

Congratulations to all the wnners and thanks to Layne Smith, NAO creator, for all his labour at this organization.
Next step NAO should take: getting popularized beyond USA.

07/06/2007

Extreme urbanization of the galician coast


This graphic of La Voz de Galicia, made by Manuela Mariño, was awarded on the last Malofiej. It's about the urbanization of the coast. Although I don't show here the key, I can tell you that blue circles means the new houses built the past year on each village or city, and the circunferences are the change of the population last year (green if it grows, red if it decreases). One of those graphics, a little Juan Velasco look-alike, usuallly succesful at Malofiej (absolutelly deserved, from my point of view). At first sight, you can see how some villages have their population decreasing and the number of houses houses growing. If you don't know Galicia I shoul tell you that the shape of the graphic is showing the galician coast. Inner villages have a more balanced system, meanwhile coast villages are the opposite.
A good example about how to explainhard data in a visual way, showing the problem clearly. No spectacular 3d, but a lot of information.

But, the big problem with this graphic was other. It was just published in ono of the seven editions of La Voz de Galicia, the first printed. The rest of editions have the same information, but with a photo instead the graphic. I don't know the reasons. Do editors thought that the graphic was too confusing or too plain? Maybe, but I don't know. Was it a clear, useful and good graphic, giving extra value to the information? Of course.

The graphics department? On that corner, behind the wall...


This is the new newsroom of AP, an example of multimedia integration, according to what I have heard.
As infographics artist, first thinh I lloked for was the infographics department. My search wasn't too long. I knew where I had to look. They're on a corner. Behind a wall. It looks like almost every newspapers have the graphics department cornered. And we're talking a bout a department that it based on collaborations with other departments. OK, every single department must collaborate with others, but some of them like graphics, design and layout, correctors, research... can't work alone.
But, it's true that much infographics departments prefer to keep hidden.
I prefer this option:

GRAPHIC: Pablo Ramírez, Innovations in Newspapers global report

Graphics and photo beside the "superdesk" with the editors, next to the epicentre of the newsroom (as every single department). I know a lot of people would prefer being far along from editors, but think in the tiem you'd save everytime they want you to change every single detail...

06/06/2007

Weather in the new The Virginian Pilot

Today was launched the redesign of The Virginian Pilot. And its weather page called inmediately my attention...


We'll talk another day about if the weather page is adesign or an infographics matter (in my opinion is a mix of both), but, as it is a daily mission for most of us, I'll tell what surprised me.

First of all, we're seeing here the rotated page. Actually, it is printed vertical, and you have to rotate the paper to read it.
The are no icons of suns, clouds... on the map. This information is showed with a text. Something I'm not used to see. They just use icons to show the weather in the week. With a child as anchorman (I suppose we'll have a different kid each day). A way to involve reader.
They also have the Navy Bases weather (my european mind doesn't understand it very well).
Big space for tides, natural, in a state with so many kilometers of coast.

I can't say nothing good or bad about it. Weather pages depend so much on their target taht, without having ever been in Virginia in my whole life, I can't have a reasoned opinion. I just can say that it's original. And it has the same target that the general redesign: involve readers, and this is something that hardly can be a failure. Original. Not a usual thing in this kind of pages...

04/06/2007

Online graphics in Europe


Graphics are so useful online as on print, although video can solve some problems solved by graphics on newspapers. But in Europe, infographics artists are hard to find on digital newsrooms. We can put the blame on the offer or the demand, but taking a look to the principal on-line media of the continent, just Spain and England have something to say about online graphics. That doesn't happen on print. A big mistake. Reading on a screen is harder than on a paper, graphics explain thing in a direct way, more visual, not so many text. Something more effective on the internet.

Obviously, there are a lot of media on Europe with online graphics that I didn't notice, so, if you know any, just tell me, in a comment or by e-mail (you have my mail address on the sidebar), to develop a more complete map. Thanks in advance.

America is other world, USA, Canada and all Latin America cares more about online graphics, but we're still on the Old Europe.

Update
Included diariodecadiz.es (How coud I forget myself...) and EITB.com